September 05, 2025 a 11:44 am
UDR: Fibonacci Analysis - UDR, Inc.
UDR, Inc., a leading multifamily real estate investment trust, has shown a notable downtrend in recent months. With its large portfolio in strategic U.S. markets, the company continues to focus on long-term value for shareholders. Analyzing recent market dynamics could provide insights into potential recovery or further declines.
Fibonacci Analysis
| Trend Analysis | Details |
|---|---|
| Start Date | 2024-09-12 |
| End Date | 2025-09-04 |
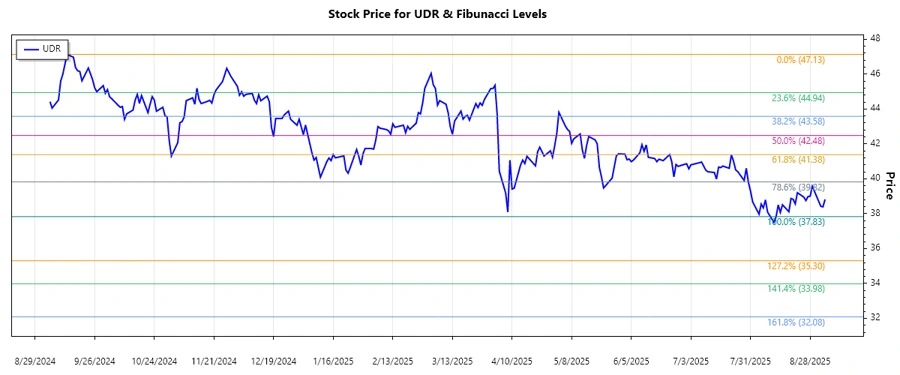
| High Price (Date) | 47.13 (2024-09-12) |
| Low Price (Date) | 37.83 (2025-08-12) |
| Fibonacci Level | Price Level |
|---|---|
| 0.236 | 39.94 |
| 0.382 | 41.30 |
| 0.5 | 42.48 |
| 0.618 | 43.66 |
| 0.786 | 45.32 |
The current price of UDR is 38.82, which places it below the 0.236 Fibonacci retracement level. This suggests a strong ongoing downward trend.
Technically, this indicates a potential for further downside unless a reversal occurs, possibly finding support at these retracement levels.
Conclusion
UDR, Inc. continues to exhibit strong downward momentum, reflecting broader challenges in the sector. While the company's fundamentals remain sound, the technical analysis suggests caution for short-term investors. Retracement levels offer potential resistance or pivot points for traders to consider. Analysts should focus on economic indicators and sector-specific news that might signal a change in trend. The real estate market conditions and interest rate environments will heavily influence future movements.
Smart Data Insight
Master the Perfect Entry & Exit for this Stock
Don't leave your profits to chance. Historically, this stock follows specific seasonal patterns that institutional traders use to maximize returns.
- ✅ Identify the "Golden Buying Window"
- ✅ Avoid high-risk correction cycles
- ✅ Backtested data from the last 20+ years