March 24, 2026 a 07:46 am

UDR: Dividend Analysis - UDR, Inc.
UDR, Inc. showcases a resilient dividend profile, highlighted by consistent growth and a substantial yield of 5.04%. The company's robust dividend history over 42 years suggests strong investor trust and stability. However, the high EPS payout ratio of 149.49% demands attention, indicating potential sustainability concerns if the earnings do not align with dividend payouts.
📊 Overview
Evaluating UDR, Inc.'s dividends unveils insights into its income distribution effectiveness. The sector context, competitive yield, and stable dividend payments accentuate UDR's attractiveness to income-focused investors.
| Metric | Value |
|---|---|
| Sector | Real Estate |
| Dividend yield | 5.04% |
| Current dividend per share | 1.715 USD |
| Dividend history years | 42 years |
| Last cut or suspension | None |
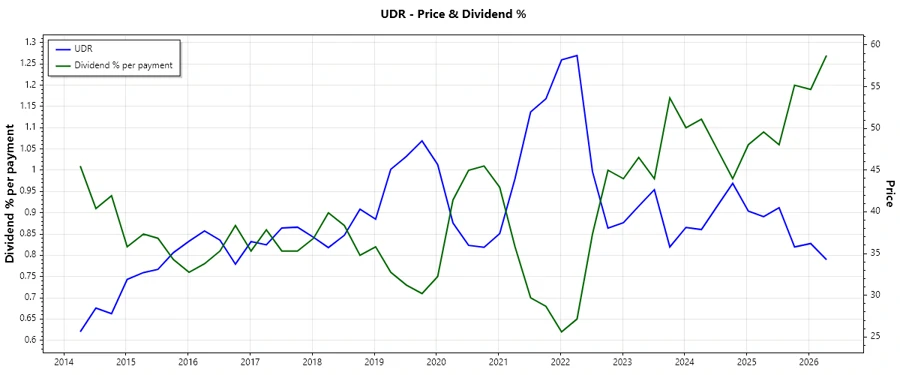
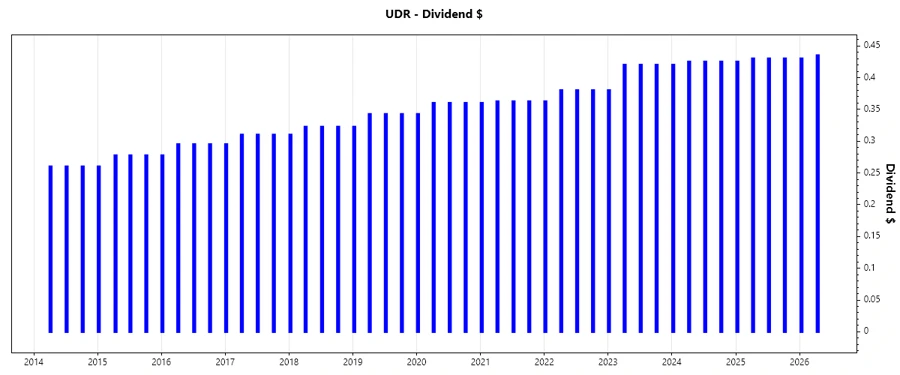
📈 Dividend History
Understanding UDR's past dividend payouts allows investors to assess its commitment to returning wealth to shareholders. The long-standing history without recent cuts indicates stability.
| Year | Dividend per Share (USD) |
|---|---|
| 2026 | 0.865 |
| 2025 | 1.715 |
| 2024 | 1.695 |
| 2023 | 1.64 |
| 2022 | 1.5025 |
📊 Dividend Growth
Dividend growth analysis over three and five years reveals UDR, Inc.'s dedication to incrementally enhancing shareholder returns, showcasing its financial health and future growth prospects.
| Time | Growth |
|---|---|
| 3 years | 4.51% |
| 5 years | 3.81% |
The average dividend growth is 3.81% over 5 years. This shows moderate but steady dividend growth.
✅ Payout Ratio
Understanding payout ratios is crucial to evaluating how UDR manages its earnings and cash flow relative to dividend payments. The following data offers insight into its fiscal management:
| Key figure | Ratio |
|---|---|
| EPS-based | 149.49% |
| Free cash flow-based | 62.41% |
The EPS-based payout ratio exceeds 100%, signaling that dividends surpass earnings, which could become unsustainable if not aligned with future earnings growth. However, the free cash flow-based ratio is a healthier 62.41%, suggesting adequate cash flow support for dividends.
💸 Cashflow & Capital Efficiency
Cash flow metrics and capital efficiency help assess the financial robustness and strategic allocation of company resources, vital for sustaining dividend payments.
| Year | 2025 | 2024 | 2023 |
|---|---|---|---|
| Free Cash Flow Yield | 7.45% | 4.23% | 4.13% |
| Earnings Yield | 3.12% | 0.63% | 3.53% |
| CAPEX to Operating Cash Flow | 0% | 30.98% | 37.51% |
| Stock-based Compensation to Revenue | 1.55% | 1.95% | 2.02% |
| Free Cash Flow / Operating Cash Flow Ratio | 100% | 69.01% | 62.49% |
Cash flow and capital efficiency metrics highlight UDR's ability to sustain its operational and capital expenditure needs. The strategically managed CAPEX coupled with high free cash flow yield supports a strong dividend outlook.
⚠️ Balance Sheet & Leverage Analysis
Analyzing UDR's balance sheet metrics provides insight into its leverage and liquidity position, crucial for understanding long-term debt sustainability and risk exposure.
| Year | 2025 | 2024 | 2023 |
|---|---|---|---|
| Debt-to-Equity | 1.88 | 1.75 | 1.50 |
| Debt-to-Assets | 58.34% | 55.14% | 52.62% |
| Debt-to-Capital | 65.30% | 63.57% | 59.99% |
| Net Debt to EBITDA | 6.14 | 6.01 | 4.43 |
| Current Ratio | 3.31 | 0.39 | 0.31 |
| Quick Ratio | 3.31 | 0.39 | 0.31 |
| Financial Leverage | 3.22 | 3.16 | 2.85 |
While UDR sports a high debt profile, its strong leverage management demonstrates an ability to navigate financial obligations effectively. Strategic leverage ensures potential growth benefits outweigh risk burdens.
🔍 Fundamental Strength & Profitability
Examining profitability and fundamental metrics gives insights into UDR's operational effectiveness and capacity to generate returns from its asset base.
| Year | 2025 | 2024 | 2023 |
|---|---|---|---|
| Return on Equity | 11.49% | 2.60% | 11.13% |
| Return on Assets | 3.56% | 0.82% | 3.91% |
| Net Margin | 22.06% | 5.36% | 27.30% |
| EBIT Margin | 18.83% | 18.23% | 40.40% |
| EBITDA Margin | 58.54% | 59.83% | 82.91% |
| Gross Margin | 25.59% | 24.94% | 24.12% |
| Research & Development to Revenue | 0% | 0% | 0% |
The sound margins and return figures suggest UDR's operational efficiency and competitive positioning, consistently driving profitability.
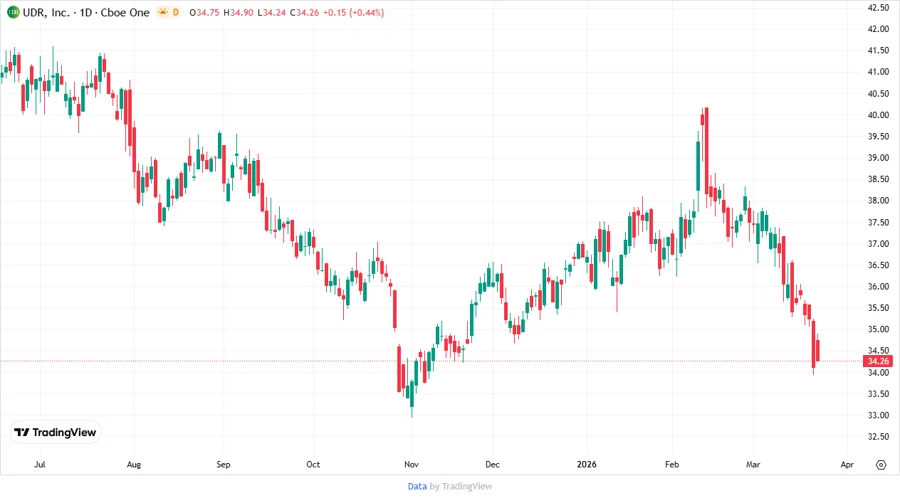
📉 Price Development
✅ Dividend Scoring System
| Category | Score | Score Bar |
|---|---|---|
| Dividend yield | 4 | |
| Dividend Stability | 5 | |
| Dividend growth | 3 | |
| Payout ratio | 2 | |
| Financial stability | 4 | |
| Dividend continuity | 5 | |
| Cashflow Coverage | 4 | |
| Balance Sheet Quality | 4 |
Total Score: 31 out of 40
🗣️ Rating
UDR, Inc.'s dividend profile exudes strength through its longstanding dividend history and reliable yield. However, potential investors should remain vigilant regarding the high payout ratio, indicating that while the dividend is sustainable now, future earnings growth is crucial to maintain this dividend trajectory without compromise. Overall, UDR, Inc. remains an attractive dividend investment amidst a balanced risk profile.
Smart Data Insight
Master the Perfect Entry & Exit for this Stock
Don't leave your profits to chance. Historically, this stock follows specific seasonal patterns that institutional traders use to maximize returns.
- ✅ Identify the "Golden Buying Window"
- ✅ Avoid high-risk correction cycles
- ✅ Backtested data from the last 20+ years