March 18, 2026 a 11:31 am
UDR: Dividend Analysis - UDR, Inc.
UDR, Inc. has been consistently growing its dividends over the years, displaying strong commitment to returning value to shareholders. With a robust market capitalization of over $11 billion and a steady dividend history spanning 42 years, UDR highlights its reliability in the real estate sector. However, the relatively high payout ratio suggests careful consideration of future earnings capacity.
📊 Overview
This section provides a succinct snapshot of UDR's dividend profile and market positioning.
| Metric | Details |
|---|---|
| Sector | Real Estate |
| Dividend Yield | 4.75% |
| Current Dividend Per Share | $1.715 |
| Dividend History | 42 years |
| Last Cut or Suspension | None |
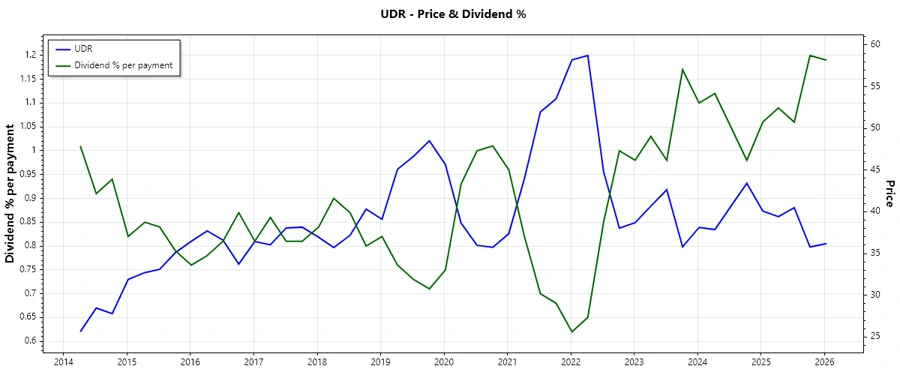
🗣️ Dividend History
UDR's dedicated dividend distribution over decades underscores its financial stability, making it a reliable choice for investors seeking steady income.
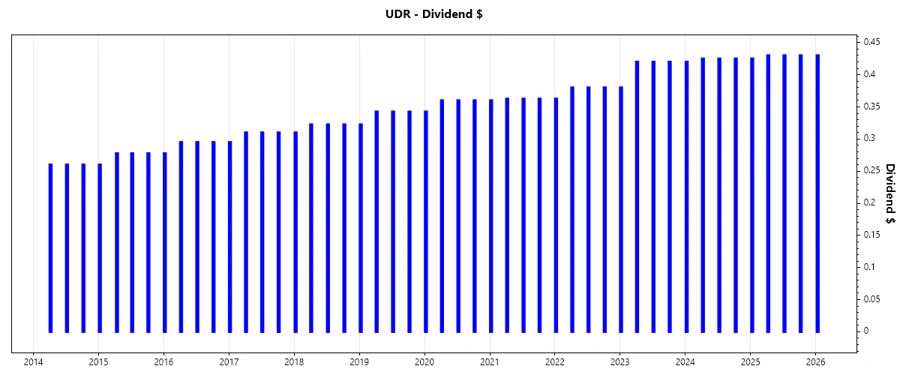
| Year | Dividend Per Share (USD) |
|---|---|
| 2026 | 0.43 |
| 2025 | 1.715 |
| 2024 | 1.695 |
| 2023 | 1.64 |
| 2022 | 1.5025 |
📈 Dividend Growth
Dividend growth is a key indicator of both management's confidence in the company's future and its ability to distribute earnings.
| Time | Growth |
|---|---|
| 3 years | 4.51% |
| 5 years | 3.81% |
The average dividend growth is 3.81% over 5 years. This shows moderate but steady dividend growth.
📉 Payout Ratio
Payout ratios provide insight into the sustainability of UDR's dividends as a proportion of its earnings and cash flow.
| Key figure | Ratio |
|---|---|
| EPS-based | 149.49% |
| Free cash flow-based | 62.41% |
The EPS payout ratio of 149.49% indicates dividends currently exceed earnings, while the 62.41% FCF coverage suggests more sustainable cash flow backing.
💰 Cashflow & Capital Efficiency
Both cash flow generation and capital efficiency are crucial for ongoing dividend payments and strategic growth investments.
| Metric | 2025 | 2024 | 2023 |
|---|---|---|---|
| Free Cash Flow Yield | 7.45% | 4.23% | 4.13% |
| Earnings Yield | 3.12% | 0.63% | 3.53% |
| CAPEX to Operating Cash Flow | 0% | 0.31% | 0.38% |
| Stock-based Compensation to Revenue | 1.55% | 1.95% | 2.02% |
| Free Cash Flow / Operating Cash Flow Ratio | 100% | 69.01% | 62.49% |
Strong cash flow yields and balanced CAPEX emphasize efficient capital use, yet reliance on stock compensation could dilute long-term shareholder value.
🏢 Balance Sheet & Leverage Analysis
Robust financial metrics, such as debt and liquidity ratios, are essential to maintain healthy leverage levels and assure creditors.
| Metric | 2025 | 2024 | 2023 |
|---|---|---|---|
| Debt-to-Equity | 188.15% | 174.52% | 149.95% |
| Debt-to-Assets | 58.34% | 55.14% | 52.62% |
| Debt-to-Capital | 65.30% | 63.57% | 59.99% |
| Net Debt to EBITDA | 6.14 | 6.00 | 4.43 |
| Current Ratio | 3.31 | 0.39 | 0.31 |
| Quick Ratio | 3.31 | 0.39 | 0.31 |
| Financial Leverage | 3.23 | 3.16 | 2.85 |
High leverage ratios signal caution for future debt obligations, while healthier current and quick ratios reflect improved short-term liquidity and independence from creditors.
🧮 Fundamental Strength & Profitability
Measures of profitability and operational efficiency are key indicators of financial health and operational competence.
| Metric | 2025 | 2024 | 2023 |
|---|---|---|---|
| Return on Equity | 11.49% | 2.60% | 11.13% |
| Return on Assets | 3.56% | 0.82% | 3.91% |
| Margins: Net | 22.06% | 5.36% | 27.30% |
| Margins: EBIT | 18.83% | 18.23% | 40.40% |
| Margins: EBITDA | 58.54% | 59.83% | 82.91% |
Strong ROE and profit margins in the recent year commend UDR's operational efficiency, notably outperforming recent fiscal periods.
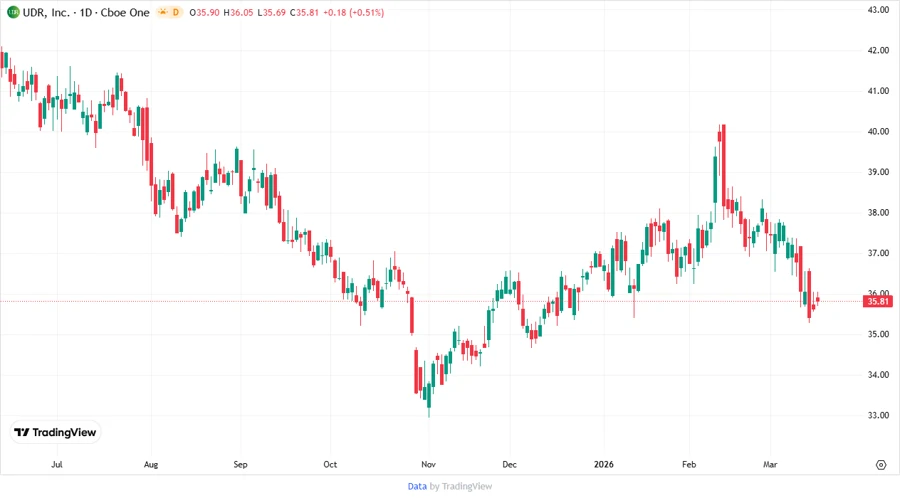
🚀 Price Development
🔍 Dividend Scoring System
| Category | Score | Score Bar |
|---|---|---|
| Dividend yield | 4 | |
| Dividend Stability | 5 | |
| Dividend growth | 3 | |
| Payout ratio | 2 | |
| Financial stability | 3 | |
| Dividend continuity | 5 | |
| Cashflow Coverage | 4 | |
| Balance Sheet Quality | 3 |
Total Score: 29/40
✅ Rating
Overall, UDR demonstrates a solid ability to maintain and grow dividends, supported by long-standing distribution history and sound financial strategies. Despite high payout ratios presenting potential concerns, their commitment to dividend stability and reasonable financial health underpin an optimistic outlook for income-focused investors. Investors are advised to remain cautious of leverage levels yet encouraged by consistent cash flow generation and capital efficiency.
Smart Data Insight
Master the Perfect Entry & Exit for this Stock
Don't leave your profits to chance. Historically, this stock follows specific seasonal patterns that institutional traders use to maximize returns.
- ✅ Identify the "Golden Buying Window"
- ✅ Avoid high-risk correction cycles
- ✅ Backtested data from the last 20+ years