August 06, 2025 a 04:03 am


UBER: Trend and Support & Resistance Analysis - Uber Technologies, Inc.
Uber Technologies, Inc., a leading technology firm, is at the forefront of the ridesharing and delivery industries. Over recent months, its stock has displayed volatility characteristic of the tech sector, yet it retains a promising market position due to its diverse service range. With this analysis, we delve into the stock's recent trend patterns and identify key support and resistance levels.
Trend Analysis
| Date | Close Price | Trend |
|---|---|---|
| 2025-08-05 | $89.39 | ▲ Uptrend |
| 2025-08-04 | $88.43 | ▲ Uptrend |
| 2025-08-01 | $86.91 | ▲ Uptrend |
| 2025-07-31 | $87.75 | ▲ Uptrend |
| 2025-07-30 | $87.64 | ⚖️ Sideways |
| 2025-07-29 | $87.11 | ⚖️ Sideways |
| 2025-07-28 | $90.60 | ▲ Uptrend |
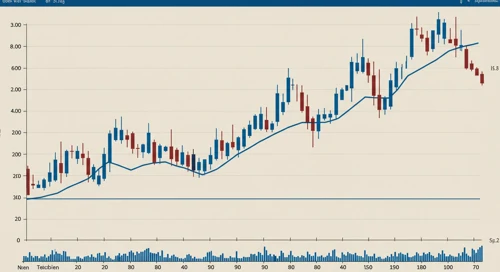
The calculated EMA20 and EMA50 indicate a shifting dynamic with a tendency towards an uptrend, which can signify a bullish sentiment returning.
Support and Resistance
| Zone Type | From | To | Description |
|---|---|---|---|
| Support 1 | $84.00 | $86.00 | Strong base, acting as a potential safety net |
| Support 2 | $79.00 | $81.00 | Previous reaction zone |
| Resistance 1 | $92.00 | $94.00 | Potential selling pressure area |
| Resistance 2 | $96.00 | $98.00 | Historical high, potential breakout area |
The current price hovers just below a significant resistance zone, suggesting possible challenges in upward momentum unless breakthrough forces prevail.
Conclusion
Uber Technologies’ stock is showcasing a slight bullish trend with imminent support levels likely to cushion any short-term drops. Navigating resistance could open higher potential reaches for investors. While uncertainties remain, especially in tech sectors, Uber’s diverse market operation offers intrinsic growth opportunities. Investors should stay vigilant about global market shifts but recognize Uber's leverage in technology-driven ecosystems.