August 04, 2025 a 01:15 pm


UBER: Trend and Support & Resistance Analysis - Uber Technologies, Inc.
Uber Technologies, Inc. (UBER) operates a robust technological platform connecting consumers with various service providers across rideshare, meal delivery, and freight logistics. The latest data analysis shows shifting trends that potential investors should carefully consider. The company's broad operational segments present diverse opportunities for growth, but also expose it to sector-specific risks.
Trend Analysis
| Date | Close Price | Trend |
|---|---|---|
| 2025-08-01 | $86.91 | ▲ |
| 2025-07-31 | $87.75 | ▲ |
| 2025-07-30 | $87.64 | ▲ |
| 2025-07-29 | $87.11 | ▲ |
| 2025-07-28 | $90.6 | ▲ |
| 2025-07-25 | $91.29 | ▲ |
| 2025-07-24 | $90.87 | ▲ |
The trend over the last few days shows a dominant ▲ upward movement as the EMA20 surpasses the EMA50. This pattern indicates a potential continued growth phase in UBER's stock price, likely driven by market confidence in the company's performance.
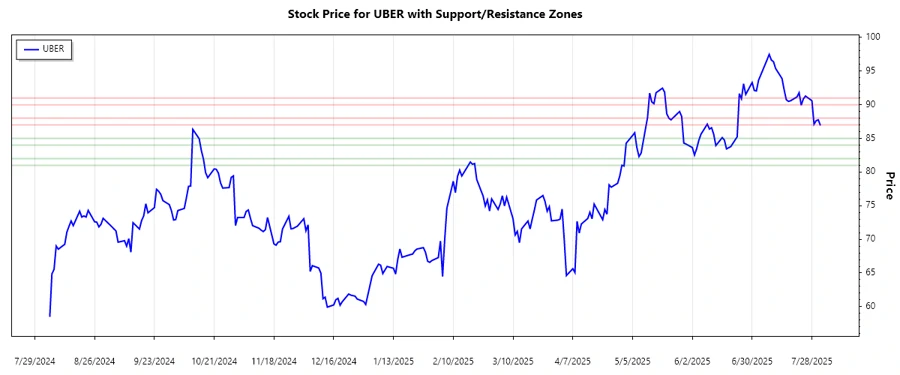
Support- and Resistance
| Zone | From | To | |
|---|---|---|---|
| Resistance 1 | $90.00 | $91.00 | ▲ |
| Resistance 2 | $87.00 | $88.00 | ▲ |
| Support 1 | $84.00 | $85.00 | ▼ |
| Support 2 | $81.00 | $82.00 | ▼ |
Currently, UBER's price is approaching the upper resistance zone between $90.00 and $91.00. If it breaks through this level, a bullish run might ensue, otherwise, the price might retrace back to the support zones.
Conclusion
The analysis suggests UBER is in a promising position with an upward trend currently in effect. While near-term resistance levels need to be monitored, the company's expansive market scope across various sectors offers potential for growth. Investors should weigh the opportunities against inherent risks in UBER's operational segments. A breakthrough past current resistance points might signal additional bullish momentum but staying vigilant for sudden market shifts is advisable.
Smart Data Insight
Master the Perfect Entry & Exit for this Stock
Don't leave your profits to chance. Historically, this stock follows specific seasonal patterns that institutional traders use to maximize returns.
- ✅ Identify the "Golden Buying Window"
- ✅ Avoid high-risk correction cycles
- ✅ Backtested data from the last 20+ years