July 03, 2025 a 02:03 pm
UBER: Trend and Support & Resistance Analysis - Uber Technologies, Inc.
Uber Technologies, Inc. continues to establish its foothold in the global mobility and delivery service market. The stock has been displaying resilience amidst market fluctuations, primarily driven by its robust business model and expanding services. In this analysis, we will explore the recent trends and pivotal support and resistance levels, giving investors a clearer understanding of the stock's future potential.
Trend Analysis
| Date | Closing Price | Trend |
|---|---|---|
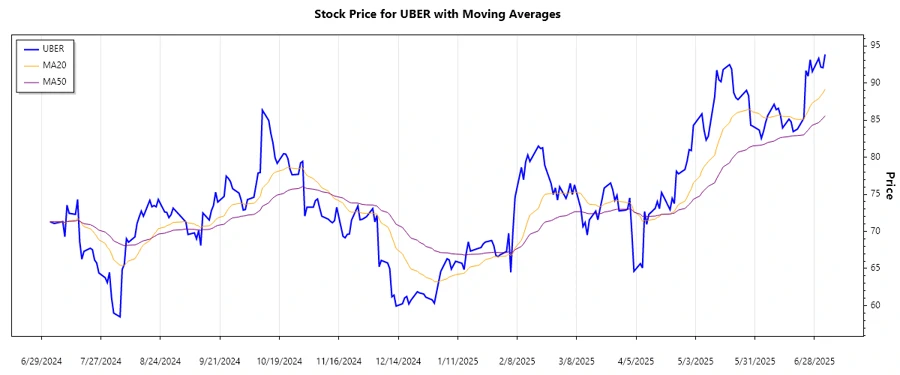
| 2025-07-03 | 93.84 | ▲ (Upward Trend) |
| 2025-07-02 | 92.05 | ▲ (Upward Trend) |
| 2025-07-01 | 92.13 | ▲ (Upward Trend) |
| 2025-06-30 | 93.30 | ▲ (Upward Trend) |
| 2025-06-27 | 91.53 | ▲ (Upward Trend) |
| 2025-06-26 | 93.12 | ▲ (Upward Trend) |
| 2025-06-25 | 90.90 | ▲ (Upward Trend) |
The analysis of Uber's stock trend over the last week shows a robust upward trend as the EMA20 surpasses EMA50. This indicates strong bullish sentiment, reflecting confidence in Uber's market position.
Support- and Resistance
| Zone | Value (USD) |
|---|---|
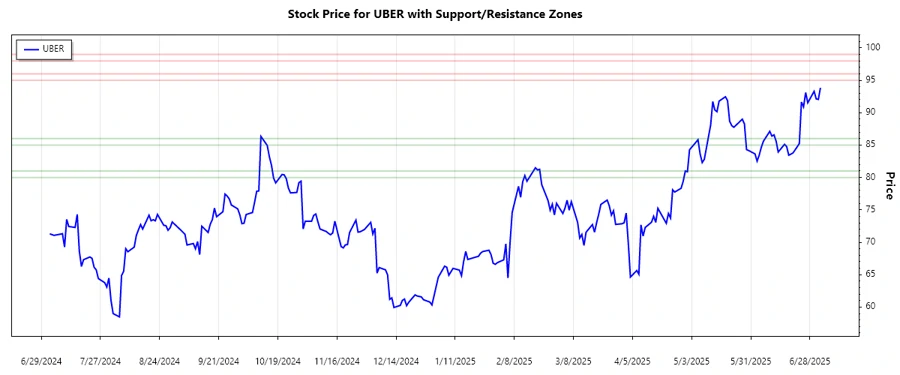
| Support Zone 1 | ▼ 85.00 - 86.00 |
| Support Zone 2 | ▼ 80.00 - 81.00 |
| Resistance Zone 1 | ▲ 95.00 - 96.00 |
| Resistance Zone 2 | ▲ 98.00 - 99.00 |
Currently, the stock price is situated between the support zone of 85.00 - 86.00 and the resistance zone of 95.00 - 96.00, indicating a neutral bias as traders monitor for breaks beyond these levels.
Conclusion
Uber Technologies, Inc. displays a promising technical setup, driven by an upward momentum and clear support and resistance markers. The positive trend suggests potential for continued growth, although investors should watch out for any macroeconomic shifts or competitive pressures that could impact this trajectory. Analyzing such trends could allow investors to time their entries strategically, maximizing potential returns while mitigating risks.