May 05, 2026 a 06:00 pm

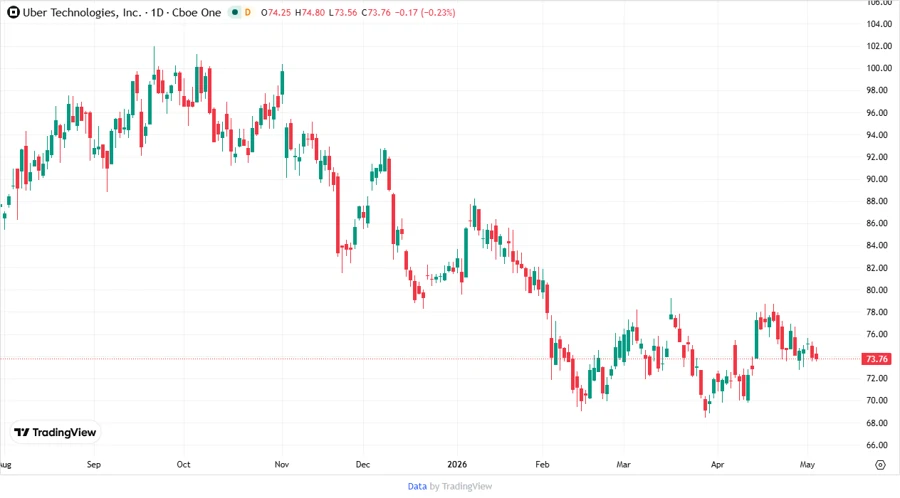
UBER: Fundamental Ratio Analysis - Uber Technologies, Inc.
Uber Technologies, Inc., known for revolutionizing passenger transport and delivery services, shows promising signs of growth across its multiple segments. As a tech-driven platform, Uber has strategically positioned itself in various regions, leveraging innovation to optimize user experience.
Fundamental Rating
The current fundamental rating of Uber reflects strong operational markers and commendable financial health, manifesting in an "A" grade overall.
| Rating Category | Score | Visualization |
|---|---|---|
| Discounted Cash Flow | 5 | |
| Return on Equity | 5 | |
| Return on Assets | 5 | |
| Debt to Equity | 2 | |
| Price to Earnings | 3 | |
| Price to Book | 2 |
Historical Rating
An evaluation of Uber's historical performance helps understand past financial strategies influencing current stability.
| Date | Overall Score | DCF | ROE | ROA | D/E | P/E | P/B |
|---|---|---|---|---|---|---|---|
| 2026-05-05 | 4 | 5 | 5 | 5 | 2 | 3 | 2 |
| N/A | 0 | 5 | 5 | 5 | 2 | 3 | 2 |
Analyst Price Targets
Analyst projections indicate a bullish potential in Uber's stock prices, with a notable consensus for growth amid diverse market operations.
| High | Low | Median | Consensus |
|---|---|---|---|
| 125 | 72 | 105 | 103.42 |
Analyst Sentiment
The consensus among analysts portrays a positive outlook for Uber, with a predominant inclination towards buying.
| Recommendation | Count | Representation |
|---|---|---|
| Strong Buy | 1 | |
| Buy | 49 | |
| Hold | 11 | |
| Sell | 0 | |
| Strong Sell | 0 |
Conclusion
Uber Technologies, Inc. continues to grow, backed by strong financial fundamentals and operational success across geographically diverse segments. The shifts in innovation and streamlined market presence mark it as a potential investment hotspot. Analysts suggest a promising trajectory with encouraging price targets, emphasizing the company's adaptability and market influence. However, the fluctuating regulatory environments and competitive pressures remain pivotal to monitor.
Smart Data Insight
Master the Perfect Entry & Exit for this Stock
Don't leave your profits to chance. Historically, this stock follows specific seasonal patterns that institutional traders use to maximize returns.
- ✅ Identify the "Golden Buying Window"
- ✅ Avoid high-risk correction cycles
- ✅ Backtested data from the last 20+ years