October 13, 2025 a 05:15 am
UBER: Fibonacci Analysis - Uber Technologies, Inc.
This analysis delves into the stock performance of Uber Technologies, Inc., utilizing technical analysis tools to provide insights into its recent trends. Uber, a giant in ridesharing and delivery services, influences major markets across the globe. Understanding its stock movements can help investors capitalize on market opportunities. However, fluctuating market dynamics, especially in the competitive tech-driven sectors, can impact its stock performance.
Fibonacci Analysis
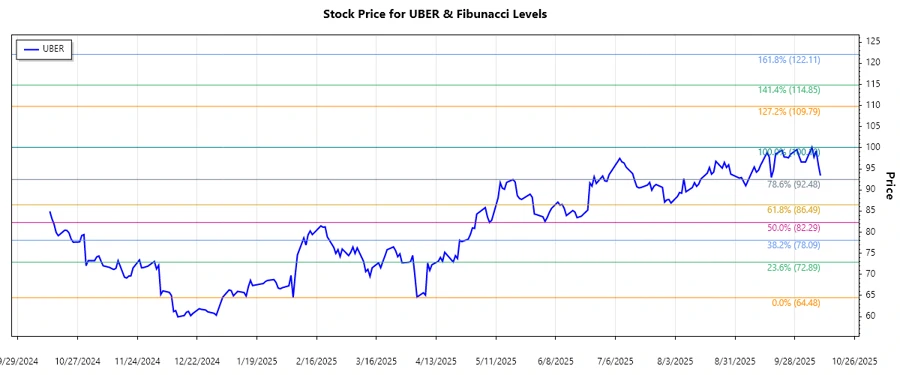
The recent trend analysis of Uber Technologies (UBER) indicates a strong upward momentum from mid-June 2025 to early October 2025. Using the high price of $100.1 observed on 2025-10-06 and the low point of $64.48 on 2025-02-05, we calculate the Fibonacci levels to predict potential support and resistance levels.
| Analysis Detail | Date | Price |
|---|---|---|
| Trend Start Date | 2025-06-05 | - |
| Trend End Date | 2025-10-06 | - |
| High Point | 2025-10-06 | $100.1 |
| Low Point | 2025-02-05 | $64.48 |
| Fibonacci Level | Price Level |
|---|---|
| 0.236 | $73.42 |
| 0.382 | $80.57 |
| 0.5 | $82.29 |
| 0.618 | $86.76 |
| 0.786 | $93.09 |
Currently, the stock price resides around $93.4, positioning it near the 0.786 retracement level, indicating potential resistance. Such positioning suggests that the stock may face selling pressure soon unless it breaks above convincingly.
Conclusion
Uber Technologies, Inc. has shown a strong upward trend, bolstered by positive market responses and operational expansion. The proximity of the current price to a significant Fibonacci retracement level could suggest an impending consolidation or correction. Investors should watch for a breakout past the $93.09 resistance level for further gains. Despite recent growth, the competitive landscape and regulatory changes pose risks that could impact future performance. However, strategic positioning in mobility and delivery services enhances its long-term growth potential.
Smart Data Insight
Master the Perfect Entry & Exit for this Stock
Don't leave your profits to chance. Historically, this stock follows specific seasonal patterns that institutional traders use to maximize returns.
- ✅ Identify the "Golden Buying Window"
- ✅ Avoid high-risk correction cycles
- ✅ Backtested data from the last 20+ years