October 31, 2025 a 09:16 am


Technology Stocks - Performance Analysis
📊 The technology sector has shown significant volatility in recent times, with stocks exhibiting varying performance over different periods. As we dive into a detailed breakdown of weekly, monthly, and quarterly performances, traders and investors must pay close attention to both top performers and the underperformers in the space. Understanding these dynamics is crucial to navigating the sector's complexities and making informed investment decisions.
Technology Stocks Performance One Week
✅ This week, NVDA stands out with a remarkable performance of 8.78%, positioning it as the top performer among technology stocks. On the other hand, ORCL has faced a significant setback with a decline of 9.54%, marking it as the week's largest underperformer. This divergence highlights the sector's mixed performance, necessitating careful analysis for short-term trade decisions.
| Stock | Performance (%) | Performance |
|---|---|---|
| NVDA | 8.78 | |
| AVGO | 6.29 | |
| PLTR | 5.40 | |
| AAPL | 3.24 | |
| CSCO | 3.24 | |
| IBM | 0.87 | |
| CRM | 0.74 | |
| ACN | 0.69 | |
| MSFT | 0.47 | |
| ORCL | -9.54 |
Technology Stocks Performance One Month
📈 Over the past month, AVGO leads with a robust performance of 13.18%, while ORCL continues to decline, showing a 10.75% drop. Monthly trends indicate a stronger recovery in contrast to weekly fluctuations, suggesting investors are favoring stability over short-term gains.
| Stock | Performance (%) | Performance |
|---|---|---|
| AVGO | 13.18 | |
| CRM | 9.04 | |
| NVDA | 8.61 | |
| IBM | 8.41 | |
| AAPL | 6.29 | |
| CSCO | 6.06 | |
| PLTR | 5.92 | |
| ACN | 2.57 | |
| MSFT | 1.30 | |
| ORCL | -10.75 |
Technology Stocks Performance Three Months
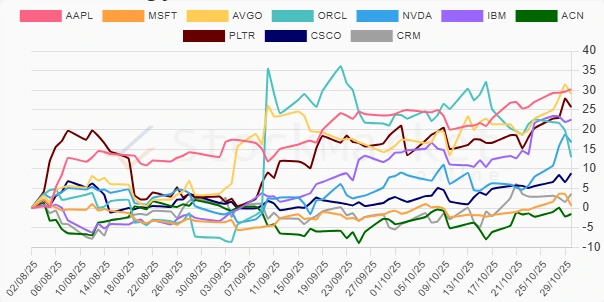
💡 Over the quarter, AAPL achieved a stellar 30.27% gain, underscoring its dominance in the technology sector. Conversely, ACN struggled with a slight drop of 1.51%, highlighting the volatility and contrasting performance within the sector. The data emphasizes both resilience and areas of concern amongst tech giants.
| Stock | Performance (%) | Performance |
|---|---|---|
| AAPL | 30.27 | |
| AVGO | 29.09 | |
| PLTR | 25.74 | |
| IBM | 22.51 | |
| NVDA | 16.78 | |
| ORCL | 13.02 | |
| CSCO | 8.86 | |
| CRM | 3.61 | |
| MSFT | 0.64 | |
| ACN | -1.51 |
Summary
🔍 In summary, the technology sector has shown both opportunities and challenges over different periods. Stocks like NVDA, AVGO, and AAPL have consistently delivered impressive results, indicating robust potential for investors focused on growth. However, the significant declines experienced by stocks such as ORCL, especially over shorter periods, suggest existing vulnerabilities. Long-term strategic planning should, therefore, balance these factors to ensure optimized portfolio performance. Overall, staying vigilant and responsive to sectorial shifts will be key to capitalizing on the highs while mitigating risks associated with underperformance.
Smart Data Insight
Master the Perfect Entry & Exit for this Stock
Don't leave your profits to chance. Historically, this stock follows specific seasonal patterns that institutional traders use to maximize returns.
- ✅ Identify the "Golden Buying Window"
- ✅ Avoid high-risk correction cycles
- ✅ Backtested data from the last 20+ years