
July 24, 2026 a 09:16 am


Technology Stocks - Performance Analysis
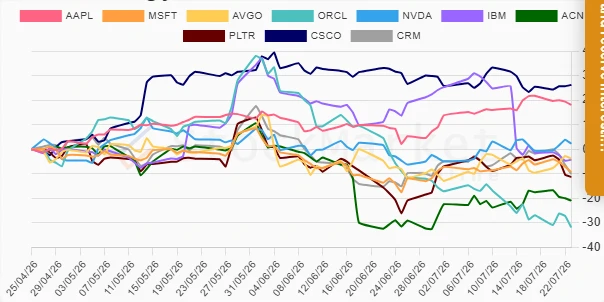
📰 The technology sector remains a dynamic and volatile marketplace. Recent trends exhibit stark contrasts among the major players, with some stocks demonstrating remarkable resilience while others experience notable downturns. The data below dives into the performance over the past week, month, and three months, providing a comprehensive view of the sector's movements. Our analysis aims to highlight top performers and identify potential causes behind underperformances.
Technology Stocks Performance One Week 📊
| Stock | Performance (%) | Performance |
|---|---|---|
| CRM | -8.25 | |
| PLTR | -6.81 | |
| ORCL | -4.87 | |
| ACN | -3.37 | |
| AAPL | -3.65 | |
| MSFT | -3.08 | |
| IBM | -2.83 | |
| CSCO | 0.75 | |
| NVDA | 2.94 | |
| AVGO | 5.77 |
Technology Stocks Performance One Month 📊
| Stock | Performance (%) | Performance |
|---|---|---|
| ORCL | -26.08 | |
| IBM | -19.70 | |
| CSCO | -5.41 | |
| MSFT | 4.79 | |
| AVGO | 3.41 | |
| CRM | 3.43 | |
| ACN | 8.00 | |
| NVDA | 5.28 | |
| PLTR | 9.42 | |
| AAPL | 9.86 |
Technology Stocks Performance Three Months 📊
| Stock | Performance (%) | Performance |
|---|---|---|
| ORCL | -31.78 | |
| ACN | -20.94 | |
| PLTR | -11.29 | |
| CRM | -10.07 | |
| MSFT | -9.33 | |
| IBM | -4.26 | |
| AVGO | -3.85 | |
| NVDA | 2.30 | |
| AAPL | 18.10 | |
| CSCO | 26.17 |
Summary 🔍
💡 The past quarter in the technology sector reveals intriguing dynamics. Stability is observed with stocks like AAPL and CSCO, which outperformed their counterparts significantly over the longer term. In contrast, stocks such as ORCL and ACN have faced substantial declines, suggesting possible sectoral or company-specific challenges. Strategic positioning in resilient stocks while carefully monitoring underperformers could yield opportune adjustments in portfolios, maximizing potential reward as the market continues its volatile trajectory. It remains crucial for investors to stay informed and act judiciously based on unfolding financial narratives.
Smart Data Insight
Master the Perfect Entry & Exit for this Stock
Don't leave your profits to chance. Historically, this stock follows specific seasonal patterns that institutional traders use to maximize returns.
- ✅ Identify the "Golden Buying Window"
- ✅ Avoid high-risk correction cycles
- ✅ Backtested data from the last 20+ years