
October 23, 2026 a 09:16 am


📊 Technology Stocks - Performance Analysis
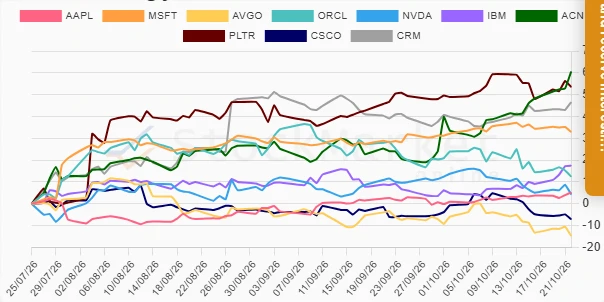
In the fast-evolving landscape of technology stocks, performance analytics over multiple timeframes reveal crucial insights for strategists and investors. Over the past weeks and months, significant volatility has been observed, with certain stocks displaying resilience while others lag behind. This analysis delves into the performances across one week, one month, and three months, highlighting key observations and trends that can inform future investment decisions.
Technology Stocks Performance One Week 📈
Over the past week, the technology sector showcased a mixed performance profile. While most stocks displayed negligible to negative returns, Accenture (ACN) led the charge with a striking 12.25% increase. IBM followed closely with an 8.37% rise. Notably, Cisco (CSCO) and Oracle (ORCL) experienced more substantial declines, marking a week of both challenges and breakthroughs within the sector.
| Stock | Performance (%) | Performance |
|---|---|---|
| ACN | 12.25% | |
| IBM | 8.37% | |
| PLTR | 5.56% | |
| CRM | 3.97% | |
| AAPL | 1.40% | |
| NVDA | -0.77% | |
| MSFT | -1.50% | |
| AVGO | -1.57% | |
| ORCL | -2.05% | |
| CSCO | -2.32% |
Technology Stocks Performance One Month 🔍
The one-month period illustrates a significant divergence between top performers and laggards. Accenture (ACN) surged spectacularly by 36.55%, overshadowing other stocks. Conversely, Oracle (ORCL) suffered a substantial decline of 12.83%, drawing attention to divergent growth narratives within the sector. Microsoft's modest climb further exemplifies disparity within the sector's dynamics.
| Stock | Performance (%) | Performance |
|---|---|---|
| ACN | 36.55% | |
| IBM | 8.30% | |
| CRM | 5.63% | |
| MSFT | 4.20% | |
| AAPL | 3.39% | |
| PLTR | 3.07% | |
| CSCO | -1.06% | |
| NVDA | -5.75% | |
| AVGO | -8.75% | |
| ORCL | -12.83% |
Technology Stocks Performance Three Months 📉
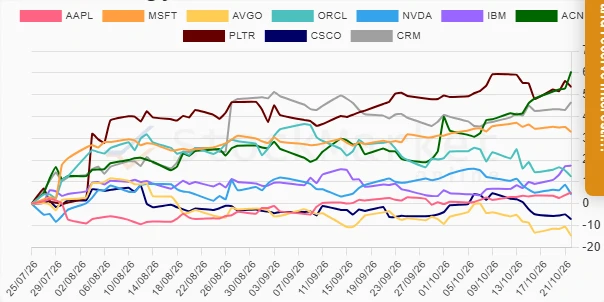
Over a broader three-month window, Accenture (ACN) and Palantir (PLTR) emerged as clear frontrunners with performance leaps of 60.52% and 53.53%, respectively. Salesforce (CRM) also showcased notable growth. Conversely, Broadcom (AVGO) with a -14.80% decline indicated potential vulnerability in its market positioning, highlighting critical differentiation within the industry's performance spectrum.
| Stock | Performance (%) | Performance |
|---|---|---|
| ACN | 60.52% | |
| PLTR | 53.53% | |
| CRM | 46.53% | |
| MSFT | 32.92% | |
| IBM | 17.48% | |
| ORCL | 12.45% | |
| AAPL | 5.19% | |
| NVDA | 4.31% | |
| CSCO | -7.09% | |
| AVGO | -14.80% |
Summary 💡
In conclusion, the technology sector's stock performance over varied timeframes reveals intriguing patterns. Accenture (ACN) consistently shines as a top performer, particularly notable over longer durations, alongside Palantir (PLTR) and Salesforce (CRM). The disparity in performances suggests strategic diversification opportunities within the sector. Investors should consider these dynamics when positioning portfolios to harness both the growth potentials and mitigate exposure to underperformers like Broadcom (AVGO). The sector remains inherently volatile but offers substantial upside potential with informed, strategic choices.
Smart Data Insight
Master the Perfect Entry & Exit for this Stock
Don't leave your profits to chance. Historically, this stock follows specific seasonal patterns that institutional traders use to maximize returns.
- ✅ Identify the "Golden Buying Window"
- ✅ Avoid high-risk correction cycles
- ✅ Backtested data from the last 20+ years