
September 18, 2026 a 09:16 am


Technology Stocks - Performance Analysis
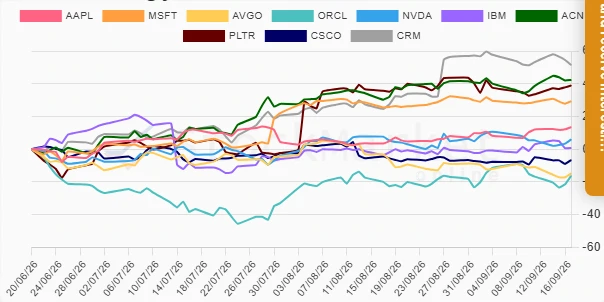
Technology stocks have experienced varied performance across different time frames, highlighting the dynamic nature of the sector. Recent trends indicate a mixture of resilience and vulnerability among leading players, with certain tech giants outperforming due to strategic advancements, while others face challenges that have impacted their growth. This analysis delves into a detailed performance review of these key technology stocks, focusing on weekly, monthly, and quarterly returns.
Technology Stocks Performance One Week 📊
| Stock | Performance (%) | Performance |
|---|---|---|
| PLTR | 5.33% | |
| ACN | 3.62% | |
| AAPL | 1.42% | |
| NVDA | 0.57% | |
| MSFT | 0.48% | |
| ORCL | 0.47% | |
| CSCO | -1.64% | |
| CRM | -1.80% | |
| IBM | -2.18% | |
| AVGO | -3.99% |
Technology Stocks Performance One Month 📈
| Stock | Performance (%) | Performance |
|---|---|---|
| CRM | 19.04% | |
| AAPL | 6.38% | |
| ORCL | 5.63% | |
| ACN | 4.43% | |
| MSFT | 2.91% | |
| NVDA | 1.62% | |
| PLTR | 1.62% | |
| IBM | 0.70% | |
| CSCO | -0.07% | |
| AVGO | -3.86% |
Technology Stocks Performance Three Months 📉
| Stock | Performance (%) | Performance |
|---|---|---|
| CRM | 51.45% | |
| ACN | 42.35% | |
| PLTR | 38.88% | |
| MSFT | 29.30% | |
| AAPL | 13.51% | |
| NVDA | 5.97% | |
| IBM | 0.72% | |
| CSCO | -6.62% | |
| AVGO | -14.83% | |
| ORCL | -16.27% |
Summary 📊
The analysis of technology stocks over the specified duration reveals a mixed market sentiment. Short-term fluctuations aside, leaders like CRM and ACN have shown robust performance over the quarter, whereas AVGO and ORCL face significant downward pressures. The diversity in performance underscores both the potential for substantial gains and risks inherent within the technology sector. Investors should remain vigilant, seeking opportunities that balance potential upside with associated risks.
- ✔️ CRM and ACN exhibit substantial upward momentum.
- ⚠️ AVGO and ORCL warrant closer scrutiny due to underperformance.
Smart Data Insight
Master the Perfect Entry & Exit for this Stock
Don't leave your profits to chance. Historically, this stock follows specific seasonal patterns that institutional traders use to maximize returns.
- ✅ Identify the "Golden Buying Window"
- ✅ Avoid high-risk correction cycles
- ✅ Backtested data from the last 20+ years