
July 17, 2026 a 09:16 am


Technology Stocks - Performance Analysis
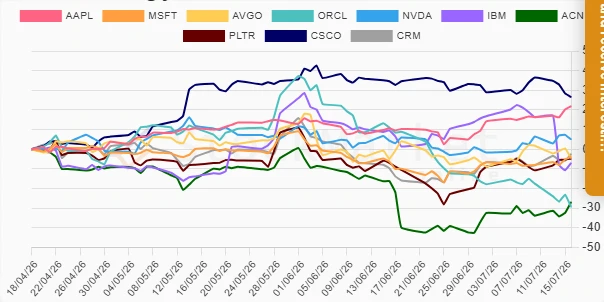
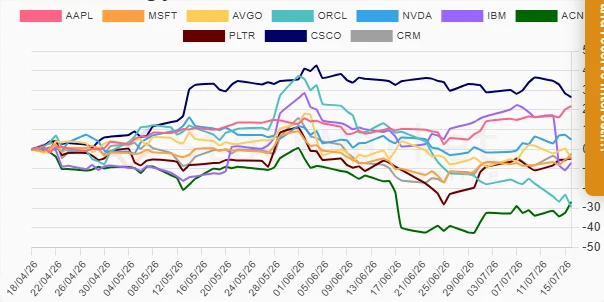
📊 The technology sector has exhibited varied performance across different timeframes. Notable movements within one week include significant gains and losses, reflecting market volatility. This analysis delves into individual stock behavior over the past week, month, and three months to provide insights on performance trends and potential investment opportunities.
Technology Stocks Performance One Week
🔍 Over the past week, ACN led the gains with a positive trajectory, while IBM experienced significant losses. The contrasting performances highlight the sector's volatility.
| Stock | Performance (%) | Performance |
|---|---|---|
| ACN | 6.94 | |
| PLTR | 5.93 | |
| CRM | 5.77 | |
| AAPL | 5.63 | |
| MSFT | 4.14 | |
| NVDA | -1.53 | |
| AVGO | -6.36 | |
| CSCO | -9.94 | |
| ORCL | -11.90 | |
| IBM | -23.26 |
Technology Stocks Performance One Month
📈 This month, AAPL emerged as a strong performer, whereas ORCL faced a stark downtrend. The data suggests a diversified range of stock responses to market conditions.
| Stock | Performance (%) | Performance |
|---|---|---|
| AAPL | 12.41 | |
| CRM | 11.38 | |
| MSFT | 6.17 | |
| PLTR | 4.05 | |
| NVDA | 1.88 | |
| AVGO | -3.91 | |
| ACN | -4.91 | |
| CSCO | -6.18 | |
| IBM | -13.47 | |
| ORCL | -37.85 |
Technology Stocks Performance Three Months
⚖️ In the three-month review, CSCO showed a strong upward momentum, while ORCL struggled the most. Long-term trends indicate the importance of assessing both current market conditions and potential growth elements.
| Stock | Performance (%) | Performance |
|---|---|---|
| CSCO | 26.53 | |
| AAPL | 21.99 | |
| NVDA | 4.90 | |
| CRM | -2.44 | |
| PLTR | -4.85 | |
| MSFT | -3.86 | |
| AVGO | -4.59 | |
| IBM | -7.00 | |
| ACN | -26.89 | |
| ORCL | -29.41 |
Summary
💡 The technology sector has displayed significant volatility, with clear outperformers and underperformers in each timeframe. AAPL and CSCO show resilient upward movements, presenting potential investment opportunities. Conversely, ORCL and IBM's significant downtrends suggest caution. Investors should consider both the short-term market fluctuations and the long-term growth trajectories for optimal asset allocation.
Smart Data Insight
Master the Perfect Entry & Exit for this Stock
Don't leave your profits to chance. Historically, this stock follows specific seasonal patterns that institutional traders use to maximize returns.
- ✅ Identify the "Golden Buying Window"
- ✅ Avoid high-risk correction cycles
- ✅ Backtested data from the last 20+ years