
November 13, 2026 a 09:16 am


Technology Stocks - Performance Analysis
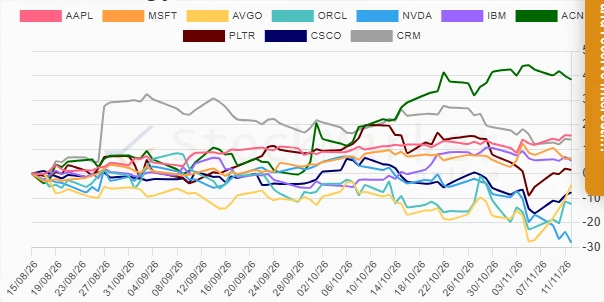
Technology stocks have shown significant variation in their performance over the past weeks and months. Particularly in the short term, high volatility has been observed, reflecting external economic conditions and sector-specific dynamics. A deep dive into these results will offer insights on recent trends and future expectations for share prices in the tech sector.
Technology Stocks Performance One Week 📊
In the past week, the technology sector saw AVGO (Broadcom) leading with an outstanding gain of 22.22%, demonstrating strong quarterly results. Conversely, NVDA (NVIDIA) suffered significantly with an 11.21% decrease, potentially due to broader semiconductor market shifts. Positive movements were also noted for ORCL, CSCO, and PLTR, indicating potential investor optimism in these stocks despite volatility.
| Stock | Performance (%) | Performance |
|---|---|---|
| AVGO | 22.22 | |
| ORCL | 9.50 | |
| CSCO | 8.50 | |
| PLTR | 6.92 | |
| AAPL | 3.64 | |
| CRM | 1.84 | |
| IBM | -0.11 | |
| MSFT | -1.35 | |
| ACN | -4.06 | |
| NVDA | -11.21 |
Technology Stocks Performance One Month 📉
Over the past month, ACN exhibited promising growth, with a performance surge of 16.10%, leading the sector. IBM also demonstrated resilience with a 7.41% rise. However, NVDA faced considerable challenges, declining by 27.36%. This can be attributed to broader market trends affecting semiconductor companies, possibly due to cyclical downturns or inventory adjustments.
| Stock | Performance (%) | Performance |
|---|---|---|
| ACN | 16.10 | |
| IBM | 7.41 | |
| AVGO | 6.98 | |
| AAPL | 3.72 | |
| ORCL | -0.29 | |
| CRM | -7.59 | |
| CSCO | -9.99 | |
| PLTR | -14.26 | |
| MSFT | -1.49 | |
| NVDA | -27.36 |
Technology Stocks Performance Three Months 📈
Over the last three months, ACN outperformed peers with a remarkable increase of 38.37%. AAPL and CRM also showed substantial gains, reflecting underlying positive fundamentals. NVDA continues to decline, showing a consistent downtrend with the highest negative return of -28.02%, which may point to major restructuring or unfavorable broader industry trends.
| Stock | Performance (%) | Performance |
|---|---|---|
| ACN | 38.37 | |
| AAPL | 15.49 | |
| CRM | 13.95 | |
| MSFT | 6.35 | |
| IBM | 5.37 | |
| PLTR | 1.58 | |
| AVGO | -4.63 | |
| CSCO | -7.61 | |
| ORCL | -12.31 | |
| NVDA | -28.02 |
Summary 🧐
The technology sector's performance highlights the inherent volatility and diverse growth trajectories. ACN is the standout performer across longer time horizons with sustained positive momentum. Conversely, NVDA's consistent decline reflects sector-specific pressures and potential operational challenges. Investors should maintain a diversified portfolio approach, considering current volatility while assessing individual company outlooks and broader macroeconomic indicators.
Smart Data Insight
Master the Perfect Entry & Exit for this Stock
Don't leave your profits to chance. Historically, this stock follows specific seasonal patterns that institutional traders use to maximize returns.
- ✅ Identify the "Golden Buying Window"
- ✅ Avoid high-risk correction cycles
- ✅ Backtested data from the last 20+ years