March 13, 2026 a 09:16 am


Technology Stocks - Performance Analysis
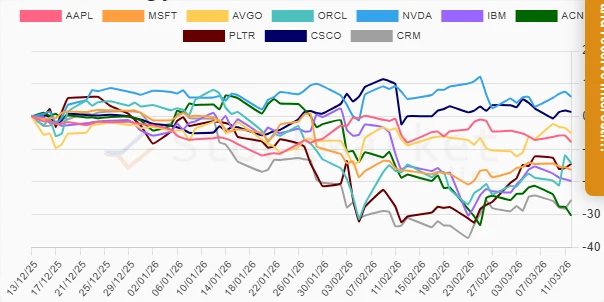
The technology sector has been exhibiting mixed performance metrics across recent timeframes. The performance variance highlights the dynamic nature of tech stocks, influenced by factors such as innovation cycles, market sentiment, and macroeconomic conditions. This analysis details performance metrics over one week, one month, and three months, spotlighting both top performers and underperformers. Investors should remain cognizant of sector-specific trends when adjusting portfolios.
📊 Technology Stocks Performance One Week
| Stock | Performance (%) | Performance |
|---|---|---|
| ACN | -9.08% | |
| IBM | -4.38% | |
| PLTR | -2.29% | |
| MSFT | -1.75% | |
| CRM | -1.34% | |
| CSCO | -1.08% | |
| AAPL | -0.64% | |
| NVDA | 3.01% | |
| AVGO | 1.77% | |
| ORCL | 4.40% |
📊 Technology Stocks Performance One Month
| Stock | Performance (%) | Performance |
|---|---|---|
| ACN | -15.20% | |
| IBM | -8.32% | |
| CSCO | -8.51% | |
| AAPL | -7.10% | |
| NVDA | -3.20% | |
| AVGO | -1.54% | |
| MSFT | -0.47% | |
| ORCL | 2.30% | |
| CRM | 8.04% | |
| PLTR | 13.03% |
📊 Technology Stocks Performance Three Months
| Stock | Performance (%) | Performance |
|---|---|---|
| ACN | -30.28% | |
| IBM | -19.69% | |
| CRM | -25.51% | |
| MSFT | -16.26% | |
| PLTR | -14.49% | |
| ORCL | -14.31% | |
| AVGO | -5.13% | |
| AAPL | -7.80% | |
| CSCO | 1.40% | |
| NVDA | 6.01% |
🔍 Summary
The technology sector's recent performance underscores the significance of agility in market navigation. While stocks like ORCL and PLTR showed resilience and growth over shorter periods, the sector was marked by notable underperformance of major players like ACN and IBM over the three-month horizon. For strategic investments, balancing risks with potential tech-driven gains will be key, especially in the context of rapid technological evolution and shifting macroeconomic landscapes.