February 13, 2026 a 09:16 am


Technology Stocks - Performance Analysis 📊
The technology sector has shown diverse performance trends across varying time frames. Short-term fluctuations often reflect broader market sentiments, influenced by economic reports and tech-specific news. The following analysis delves into performance metrics over one week, one month, and three months, specifying the standout performers vs. underperformers and providing insights into potential macroeconomic impacts.
Technology Stocks Performance One Week 🕒
| Stock | Performance (%) | Performance |
|---|---|---|
| ORCL | 9.61% | |
| NVDA | 0.87% | |
| MSFT | 0.25% | |
| AVGO | -0.41% | |
| CRM | -3.04% | |
| PLTR | -4.80% | |
| AAPL | -5.93% | |
| ACN | -7.84% | |
| CSCO | -11.44% | |
| IBM | -13.79% |
Technology Stocks Performance One Month 🗓️
| Stock | Performance (%) | Performance |
|---|---|---|
| CSCO | 1.94% | |
| NVDA | 2.74% | |
| AAPL | 1.06% | |
| AVGO | -1.84% | |
| MSFT | -12.43% | |
| CRM | -24.78% | |
| ACN | -25.14% | |
| IBM | -16.41% | |
| PLTR | -30.34% | |
| ORCL | -19.74% |
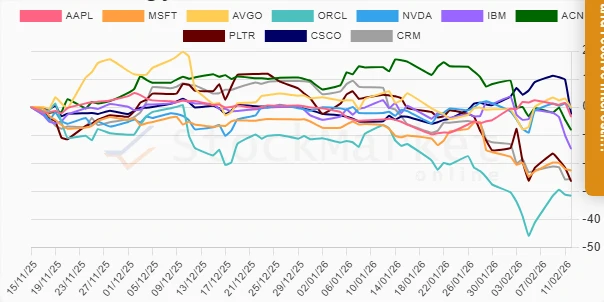
Technology Stocks Performance Three Months 📅
| Stock | Performance (%) | Performance |
|---|---|---|
| AVGO | -0.31% | |
| NVDA | -0.36% | |
| CSCO | -2.54% | |
| AAPL | -3.48% | |
| ACN | -8.15% | |
| IBM | -14.91% | |
| CRM | -25.57% | |
| PLTR | -26.48% | |
| MSFT | -22.62% | |
| ORCL | -31.59% |
Summary 🔍
Over the short term, Oracle's robust performance in the one-week analysis shows resilience, while IBM and Cisco face significant challenges. The one-month and three-month analyses highlight a more comprehensive downturn across major technology stocks, with Palantir and Accenture emerging as the steepest decliners. These trends reflect the broader challenges of navigating market volatility. Going forward, investors should remain cautious, weighing individual stock performance against industry conditions and potential future catalysts.
Smart Data Insight
Master the Perfect Entry & Exit for this Stock
Don't leave your profits to chance. Historically, this stock follows specific seasonal patterns that institutional traders use to maximize returns.
- ✅ Identify the "Golden Buying Window"
- ✅ Avoid high-risk correction cycles
- ✅ Backtested data from the last 20+ years