
April 10, 2026 a 09:16 am


Technology Stocks - Performance Analysis
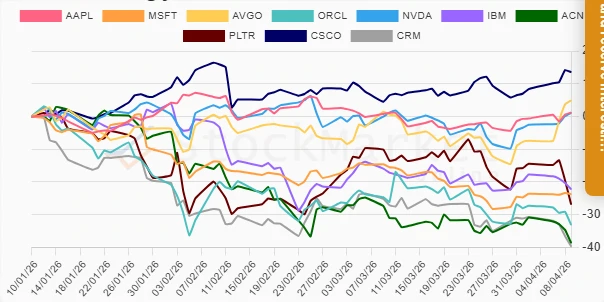
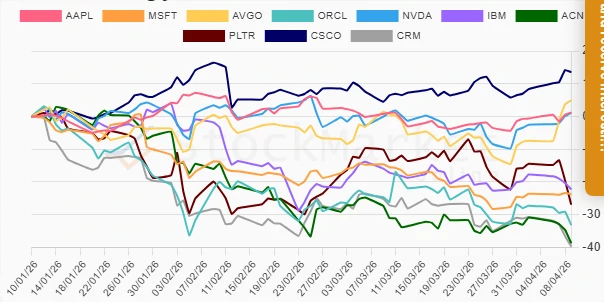
In the volatile world of technology stocks, performance analysis is crucial for understanding market trends and making informed investment decisions. Over the past quarter, several technology giants have shown mixed results, driven by macroeconomic factors and sector-specific developments. This analysis breaks down the performance of leading tech stocks across the latest one-week, one-month, and three-month periods, highlighting top performers and underperformers.
📅 Technology Stocks Performance One Week
In the past week, among the top performers in the technology sector was AVGO, soaring by 12.38%. On the flip side, PLTR experienced a sharp decline of 12.41%, marking it as the most significant underperformer during this period.
| Stock | Performance (%) | Performance |
|---|---|---|
| AVGO | 12.38 | |
| CSCO | 5.21 | |
| NVDA | 3.64 | |
| AAPL | 1.82 | |
| MSFT | -0.11 | |
| IBM | -4.50 | |
| ORCL | -5.90 | |
| ACN | -7.79 | |
| CRM | -9.00 | |
| PLTR | -12.41 |
🗓️ Technology Stocks Performance One Month
Over the last month, CSCO emerged as the leader with a 6.59% increase. Meanwhile, ORCL faced a significant downturn, plummeting by 16.20%.
| Stock | Performance (%) | Performance |
|---|---|---|
| CSCO | 6.59 | |
| AVGO | 4.67 | |
| AAPL | 0.06 | |
| NVDA | -0.68 | |
| IBM | -4.51 | |
| ACN | -7.55 | |
| CRM | -12.18 | |
| PLTR | -13.66 | |
| MSFT | -8.02 | |
| ORCL | -16.20 |
📈 Technology Stocks Performance Three Months
In an extended view, CSCO outshone others with a 13.55% uplift. Conversely, CRM showed the largest decline of 39.70%, exemplifying the sector's turbulent dynamics.
| Stock | Performance (%) | Performance |
|---|---|---|
| CSCO | 13.55 | |
| AVGO | 4.94 | |
| AAPL | 1.19 | |
| NVDA | 1.12 | |
| IBM | -22.22 | |
| MSFT | -23.74 | |
| PLTR | -26.87 | |
| ORCL | -33.14 | |
| ACN | -38.67 | |
| CRM | -39.70 |
🔍 Summary
The technology sector exemplified a mixed performance across varying timeframes, with CSCO showing robustness and CRM illustrating the sector's potential volatility. Investment strategies should thus consider both short-term trends and macroeconomic influences on the tech market. While some stocks showed resilient upward moves, others have exhibited vulnerabilities that require cautious monitoring. Investors may look for opportunities in underperforming stocks that have strong fundamentals for a potential rebound.
Smart Data Insight
Master the Perfect Entry & Exit for this Stock
Don't leave your profits to chance. Historically, this stock follows specific seasonal patterns that institutional traders use to maximize returns.
- ✅ Identify the "Golden Buying Window"
- ✅ Avoid high-risk correction cycles
- ✅ Backtested data from the last 20+ years