
October 09, 2026 a 09:16 am


Technology Stocks - Performance Analysis
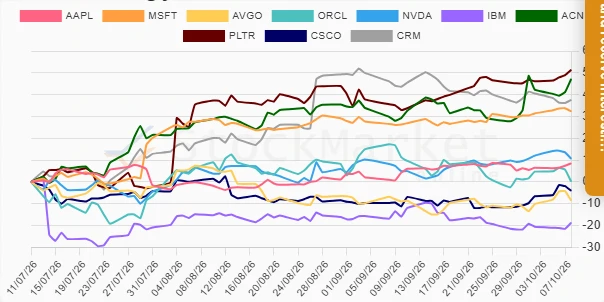
📊 The analysis of technology stocks over different time horizons reveals significant trends and divergences in performance. Over the short term, the influence of market sentiment is apparent, with certain stocks rebounding or slumping sharply. Over longer durations, the fundamental strength and strategic positioning of firms in the tech sector become clearer, heavily influenced by innovation and market conditions. This report delves into these performance trends across weekly, monthly, and quarterly periods, offering insights into the dynamic movements within this critical economic sector.
Technology Stocks Performance One Week
🔍 Weekly performance highlights diverse dynamics, from notable gains in certain stocks to steep declines in others. PLTR and ACN emerged as outstanding performers, while ORCL and NVDA observed declines.
| Stock | Performance (%) | Performance |
|---|---|---|
| PLTR | 5.22% | |
| ACN | 4.85% | |
| CSCO | 2.49% | |
| AAPL | 2.00% | |
| IBM | 1.81% | |
| AVGO | 1.59% | |
| MSFT | 1.00% | |
| NVDA | -1.42% | |
| CRM | -2.93% | |
| ORCL | -4.58% |
Technology Stocks Performance One Month
🔍 In the one-month view, ACN and PLTR led the sector with double-digit percentage gains. Meanwhile, ORCL and CRM faced challenging market conditions resulting in significant declines.
| Stock | Performance (%) | Performance |
|---|---|---|
| ACN | 19.11% | |
| PLTR | 16.24% | |
| AAPL | 7.82% | |
| MSFT | 6.28% | |
| CSCO | 5.36% | |
| NVDA | 3.29% | |
| AVGO | -0.61% | |
| IBM | -5.28% | |
| CRM | -6.50% | |
| ORCL | -16.58% |
Technology Stocks Performance Three Months
📈 Over the three months, tech giants drew significant interest, with PLTR soaring by a remarkable 51.35% and ACN trailing close behind. On the downside, IBM faced considerable challenges, underscoring diverse strategic outcomes in this quarter.
| Stock | Performance (%) | Performance |
|---|---|---|
| PLTR | 51.35% | |
| ACN | 47.15% | |
| CRM | 37.59% | |
| MSFT | 32.39% | |
| NVDA | 10.63% | |
| AAPL | 8.52% | |
| ORCL | 0.16% | |
| CSCO | -4.05% | |
| AVGO | -8.55% | |
| IBM | -18.71% |
Summary
✅ The comprehensive performance analysis of technology stocks across different periods showcases the volatility and rapid changes characteristic of the sector. Notably, short-term dynamics can heavily skew by speculative activity, while long-term analysis illustrates more stable growth paths grounded in technological advancements and market expansion. Investors stand to benefit significantly from identifying and leveraging these trends, understanding both the leading drivers of growth and the systemic risks informed by these evaluations.
Smart Data Insight
Master the Perfect Entry & Exit for this Stock
Don't leave your profits to chance. Historically, this stock follows specific seasonal patterns that institutional traders use to maximize returns.
- ✅ Identify the "Golden Buying Window"
- ✅ Avoid high-risk correction cycles
- ✅ Backtested data from the last 20+ years