
November 06, 2026 a 09:16 am


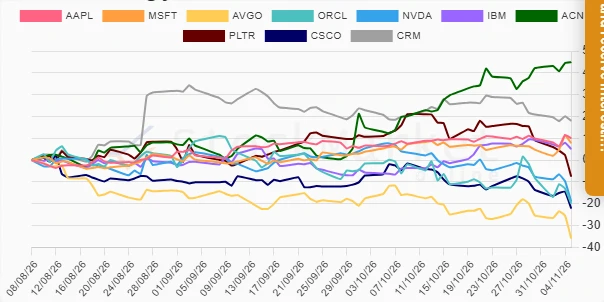
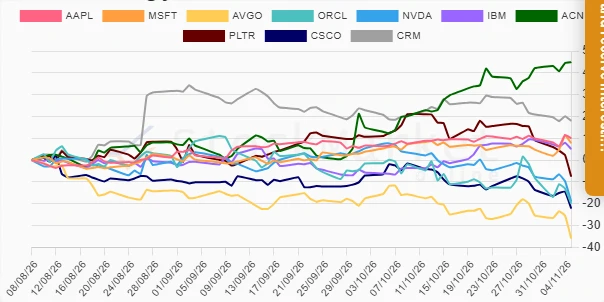
Technology Stocks - Performance Analysis
The technology sector has demonstrated remarkable fluctuations over recent weeks and months, revealing the sector's volatility and dynamic nature. Notable performance differences suggest both risks and opportunities. This analysis sheds light on the winners and losers over varying timeframes, highlighting underlying trends and market insights.
Technology Stocks Performance One Week 📊
Over the past week, technology stocks reflected mixed results amidst market volatility. Microsoft emerged as the top performer, while Palantir experienced the most significant decline. These variations underline potential sector-specific challenges or opportunities affecting individual stock movements.
| Stock | Performance (%) | Performance |
|---|---|---|
| ACN | 2.75 | |
| MSFT | 3.01 | |
| AAPL | 0.05 | |
| CRM | -2.92 | |
| IBM | -4.17 | |
| CSCO | -8.43 | |
| AVGO | -10.54 | |
| NVDA | -11.40 | |
| ORCL | -11.79 | |
| PLTR | -16.62 |
Technology Stocks Performance One Month 📉
The one-month analysis reveals significant variances, with Accenture showing stellar gains, whereas Nvidia faced substantial losses. Such disparity highlights the crucial importance of stock-specific developments influencing broader market patterns.
| Stock | Performance (%) | Performance |
|---|---|---|
| ACN | 31.05 | |
| IBM | 11.72 | |
| AAPL | 2.48 | |
| MSFT | 1.65 | |
| CRM | -0.50 | |
| CSCO | -19.67 | |
| ORCL | -19.32 | |
| PLTR | -20.96 | |
| AVGO | -24.19 | |
| NVDA | -25.87 |
Technology Stocks Performance Three Months 📈
Evaluating the last three months, Accenture has consistently outperformed, reflecting robust investor confidence and strategic positioning. On the other hand, Broadcom's downturn highlights potential headwinds and market reevaluations affecting its outlook.
| Stock | Performance (%) | Performance |
|---|---|---|
| ACN | 44.87 | |
| CRM | 18.00 | |
| AAPL | 10.01 | |
| MSFT | 7.80 | |
| IBM | 5.09 | |
| PLTR | -7.47 | |
| NVDA | -18.96 | |
| ORCL | -19.95 | |
| CSCO | -22.09 | |
| AVGO | -35.86 |
Summary 💡
Over recent months, technology stocks have shown diverse trajectories reflecting intrinsic sector volatility. Accenture and Salesforce have notably outperformed due to favorable market sentiments and strategies aligning with industry trends. Conversely, Broadcom's and Nvidia’s shortcomings highlight sector headwinds, necessitating cautious investor approaches. Prospective stakeholders should remain vigilant, focusing on both stock-specific catalysts and broader economic indicators for optimal portfolio outcomes.
Smart Data Insight
Master the Perfect Entry & Exit for this Stock
Don't leave your profits to chance. Historically, this stock follows specific seasonal patterns that institutional traders use to maximize returns.
- ✅ Identify the "Golden Buying Window"
- ✅ Avoid high-risk correction cycles
- ✅ Backtested data from the last 20+ years