
October 02, 2026 a 09:16 am


Technology Stocks - Performance Analysis
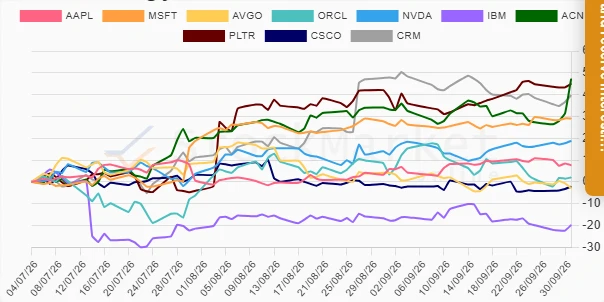
The technology sector has shown varying performance across different timelines. We observe significant outperformers in short-term windows, particularly with companies that have released positive earnings or have key market innovations. This analysis delves deeply into weekly, monthly, and quarterly performance indicators for key tech stocks, identifying trends and market sentiments that shape investment strategies.
📊 Technology Stocks Performance One Week
| Stock | Performance (%) | Performance |
|---|---|---|
| ACN | 19.90 | |
| NVDA | 2.56 | |
| CSCO | 1.93 | |
| CRM | 1.25 | |
| ORCL | 0.83 | |
| PLTR | 0.22 | |
| IBM | 0.10 | |
| MSFT | -0.65 | |
| AVGO | -2.59 | |
| AAPL | -3.15 |
📊 Technology Stocks Performance One Month
| Stock | Performance (%) | Performance |
|---|---|---|
| ACN | 14.24 | |
| PLTR | 12.16 | |
| MSFT | 3.38 | |
| NVDA | 3.09 | |
| AAPL | 1.84 | |
| CSCO | -0.32 | |
| IBM | -2.20 | |
| ORCL | -4.48 | |
| AVGO | -6.23 | |
| CRM | -7.67 |
📊 Technology Stocks Performance Three Months
| Stock | Performance (%) | Performance |
|---|---|---|
| ACN | 47.24 | |
| PLTR | 44.95 | |
| CRM | 39.74 | |
| MSFT | 29.10 | |
| NVDA | 18.81 | |
| AAPL | 7.67 | |
| ORCL | 2.06 | |
| CSCO | -2.18 | |
| AVGO | -2.84 | |
| IBM | -19.72 |
⭐ Summary
The technology sector performance reveals dynamic trends influenced by innovation, market conditions, and earnings reports. Accenture (ACN) emerged as a standout performer across all examined periods, illustrating robust strategic advancements and market optimism. On the other hand, IBM has faced significant headwinds, leading to underperformance over three months. The data underscores the volatile yet potentially rewarding nature of technology investments, particularly for companies demonstrating growth and innovation.
Smart Data Insight
Master the Perfect Entry & Exit for this Stock
Don't leave your profits to chance. Historically, this stock follows specific seasonal patterns that institutional traders use to maximize returns.
- ✅ Identify the "Golden Buying Window"
- ✅ Avoid high-risk correction cycles
- ✅ Backtested data from the last 20+ years