June 10, 2026 a 01:15 pm

TYL: Trend and Support & Resistance Analysis - Tyler Technologies, Inc.
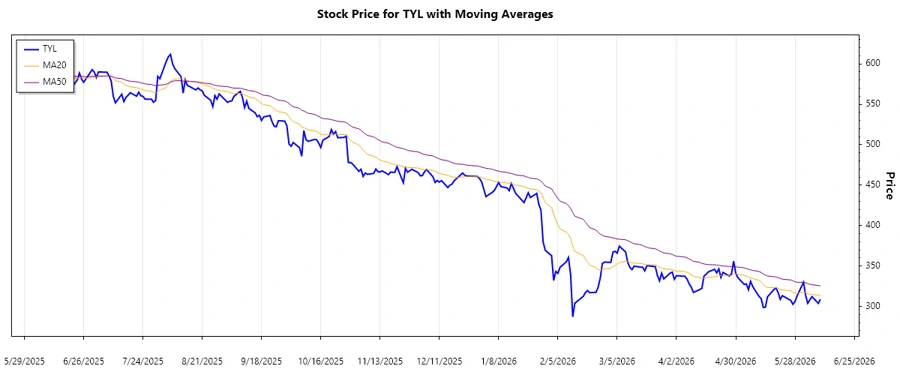
Tyler Technologies, Inc. has shown resilience in its market segment, offering comprehensive software solutions to the public sector. Recent stock data suggests a trend that investors should be conscientious of, as understanding this can impact trading decisions. This analysis will delve into current trends using EMA calculations and highlight potential support and resistance zones to guide stock investment decisions.
Trend Analysis
| Date | Close Price | Trend |
|---|---|---|
| 2026-06-09 | $308.92 | ▼ |
| 2026-06-08 | $303.77 | ▼ |
| 2026-06-05 | $312.07 | ▼ |
| 2026-06-04 | $308.15 | ▼ |
| 2026-06-03 | $303.77 | ▼ |
| 2026-06-02 | $313.56 | ▼ |
| 2026-06-01 | $329.83 | ▼ |
Recent EMA calculations indicate a dominant downtrend, as the EMA20 is consistently below the EMA50 across the analyzed days.
Support- and Resistance
| Zone Type | From | To | |
|---|---|---|---|
| Support Zone | $298.00 | $303.00 | ▲ |
| Support Zone | $320.00 | $330.00 | ▲ |
| Resistance Zone | $336.00 | $346.00 | ▼ |
| Resistance Zone | $350.00 | $360.00 | ▼ |
The current price sits within a key support zone of $298 to $303, suggesting buying interest at these levels.
Conclusion
Tyler Technologies, Inc. faces some potential downward risks as indicated by the steady decline in price trends. Investors should be cautious of further downward movement unless strong fundamental or market changes occur. The current placement within a support zone can either cap further losses or indicate a pivotal point for a potential rebound. However, strong resistance levels suggest that an upward breach would require significant momentum. Analyst focus should remain on price action relative to these zones to guide strategic entry and exit points.
Smart Data Insight
Master the Perfect Entry & Exit for this Stock
Don't leave your profits to chance. Historically, this stock follows specific seasonal patterns that institutional traders use to maximize returns.
- ✅ Identify the "Golden Buying Window"
- ✅ Avoid high-risk correction cycles
- ✅ Backtested data from the last 20+ years