
June 30, 2026 a 04:44 pm
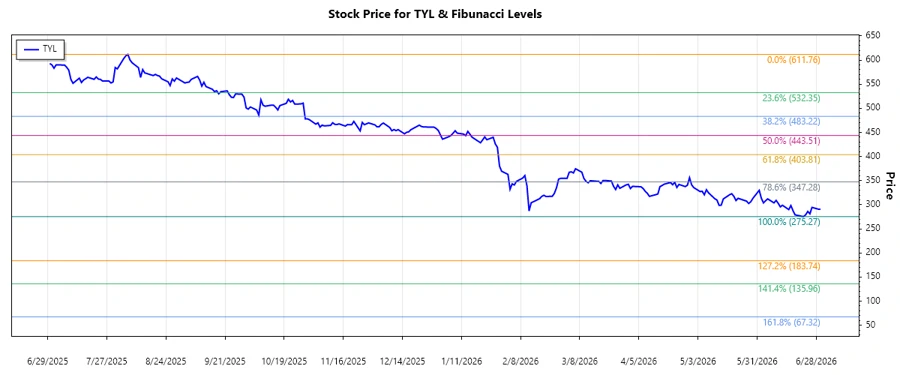
TYL: Fibonacci Analysis - Tyler Technologies, Inc.
Tyler Technologies, Inc. has exhibited a recent downtrend, offering potential buying opportunities if the stock demonstrates strong support at key Fibonacci levels. As a leader in information management solutions for the public sector, the long-term growth prospects remain promising depending on broader market conditions.
Fibonacci Analysis
| Detail | Information |
|---|---|
| Start Date | 2025-06-30 |
| End Date | 2026-06-30 |
| High Price | $611.76 on 2025-08-06 |
| Low Price | $275.27 on 2026-06-22 |
Fibonacci Retracement Levels
| Level | Price |
|---|---|
| 0.236 | $386.61 |
| 0.382 | $429.07 |
| 0.5 | $443.52 |
| 0.618 | $457.98 |
| 0.786 | $479.49 |
The current price of $290.4 indicates that the stock is not within a critical Fibonacci retracement zone, potentially awaiting a move towards support or resistance levels.
From a technical analysis perspective, $429.07 (0.382 level) could serve as the next major resistance if the price starts an upward correction or reversal.
Conclusion
The recent downtrend in Tyler Technologies' stock highlights potential risks, especially if broader market conditions remain unfavorable. However, the stock's fundamentals and its role in the public sector could provide a significant upside if economic conditions improve. Investors and analysts should keep a close eye on how the stock performs around the identified Fibonacci levels to identify possible reversal points or continuing downtrends.
Smart Data Insight
Master the Perfect Entry & Exit for this Stock
Don't leave your profits to chance. Historically, this stock follows specific seasonal patterns that institutional traders use to maximize returns.
- ✅ Identify the "Golden Buying Window"
- ✅ Avoid high-risk correction cycles
- ✅ Backtested data from the last 20+ years