
October 11, 2025 a 05:15 am

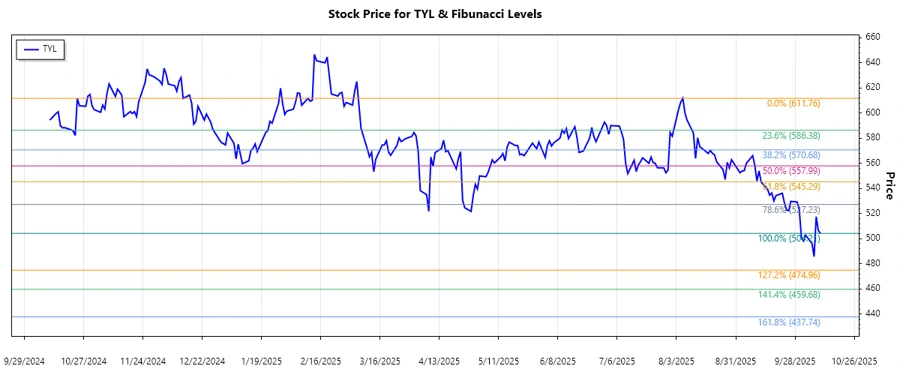
TYL: Fibonacci Analysis - Tyler Technologies, Inc.
Tyler Technologies, Inc. has demonstrated a robust track record in offering essential integrated information solutions, primarily targeting public sector entities. In the last several months, the stock of TYL has showcased a downward trend, potentially unlocking opportunities for value investors seeking to capitalize on dips. While challenges in the public sector demand solutions could present hurdles, Tyler's strategic enhancement through partnerships like Amazon Web Services may bolster its competitive edge.
Fibonacci Analysis
| Aspect | Details |
|---|---|
| Trend Start Date | 2025-08-06 |
| Trend End Date | 2025-10-10 |
| High Point (Date) | 2025-08-06 |
| High Price | $611.76 |
| Low Point (Date) | 2025-10-10 |
| Low Price | $504.21 |
Calculated Fibonacci Levels
| Level | Price ($) |
|---|---|
| 0.236 | 527.02 |
| 0.382 | 543.88 |
| 0.5 | 557.99 |
| 0.618 | 572.10 |
| 0.786 | 591.94 |
The current trading price of $504.21 suggests the stock is below the Fibonacci retracement zone. This indicates no specific retracement level being tested currently. Given the current placement, the past support levels around $527.02 and $543.88 could now act as resistance, whereas a deeper fall could trigger investors to seek support near $504.21, the recent low.
Conclusion
The historical analysis of Tyler Technologies, Inc. reveals an ongoing bearish sentiment as demonstrated by the recent downward trend. A close monitoring of the retracement levels indicates potential resistance areas should a rebound surface. However, analysts must remain cautious of further drops and weigh the fundamental partnerships and market dynamics influencing TYL’s price movements. While there is an attractive opportunity for value investing at current levels, it also underscores potential risks due to volatility inherent to the tech sector.
Smart Data Insight
Master the Perfect Entry & Exit for this Stock
Don't leave your profits to chance. Historically, this stock follows specific seasonal patterns that institutional traders use to maximize returns.
- ✅ Identify the "Golden Buying Window"
- ✅ Avoid high-risk correction cycles
- ✅ Backtested data from the last 20+ years