August 18, 2025 a 10:15 am
TYL: Fibonacci Analysis - Tyler Technologies, Inc.
Tyler Technologies, Inc. showcases a dynamic market presence through its integrated information management solutions for the public sector. The company's stock, TYL, has recently displayed some interesting price movements. By delving into the recent trend, we can make insightful observations about potential price reversals or continuations, aided by Fibonacci retracement levels.
Fibonacci Analysis
| Parameter | Value |
|---|---|
| Start Date | 2025-03-06 |
| End Date | 2025-07-29 |
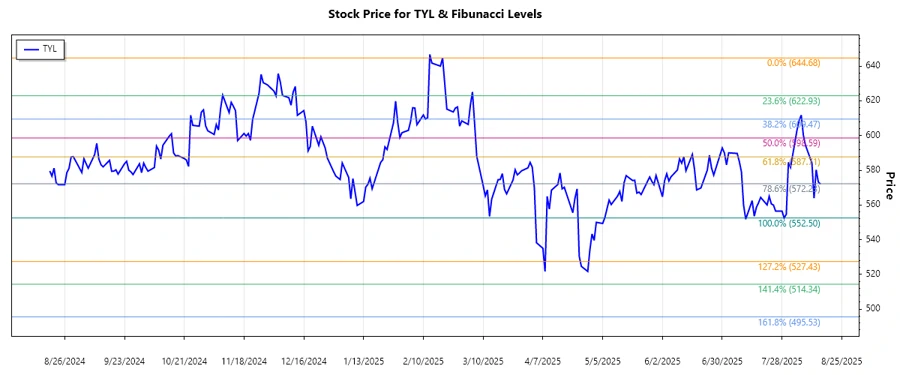
| Highest Price (Date) | 644.68 (2025-02-19) |
| Lowest Price (Date) | 552.5 (2025-07-29) |
| Fibonacci Retracement Levels | |
| 0.236 Level | 574.17 |
| 0.382 Level | 590.85 |
| 0.5 Level | 608.59 |
| 0.618 Level | 626.33 |
| 0.786 Level | 644.68 |
| Current Price Position | Approaching 0.382 Level |
| Technical Interpretation | The stock may find resistance near 0.382; a break could lead the price towards 0.5. |
Conclusion
The recent analysis of Tyler Technologies, Inc.'s stock highlights a dominant downtrend, with key resistance levels identified through Fibonacci retracement. The price is approaching a critical resistance which, if breached, could signal further bullish momentum towards higher retracement levels. However, failure to break this level might reinforce bearish sentiments. For investors, this represents an opportune moment to assess possible entry points or risk management strategies. Long-term growth remains promising, but short-term vigilance is advised due to potential volatility.
Smart Data Insight
Master the Perfect Entry & Exit for this Stock
Don't leave your profits to chance. Historically, this stock follows specific seasonal patterns that institutional traders use to maximize returns.
- ✅ Identify the "Golden Buying Window"
- ✅ Avoid high-risk correction cycles
- ✅ Backtested data from the last 20+ years