
July 08, 2026 a 09:03 am
TXN: Trend and Support & Resistance Analysis - Texas Instruments Incorporated
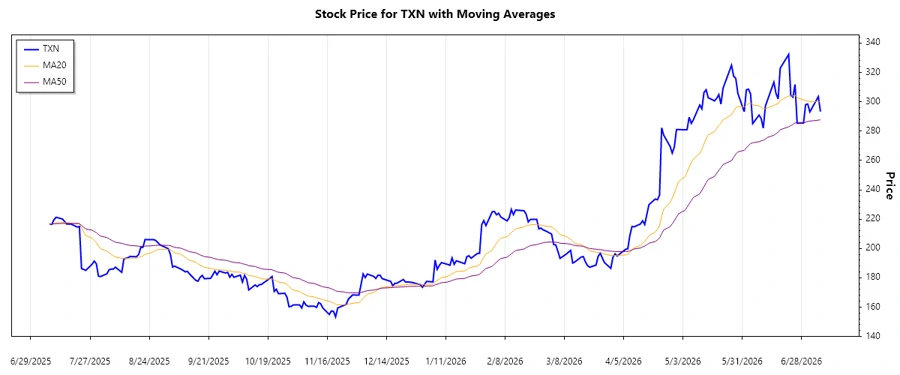
Texas Instruments (TXN) has exhibited notable volatility in its stock price, reflecting changes in the semiconductor market dynamics. The recent data points to a fluctuating trend with short-term gains and losses. Understanding these movements through technical analysis can provide insights into future price directions. The stock, with its recent performance, warrants close observation for potential investment opportunities.
Trend Analysis
| Date | Close Price | Trend |
|---|---|---|
| 2026-07-07 | 293.3 | ▲ |
| 2026-07-06 | 303.5 | ▼ |
| 2026-07-02 | 293.08 | ▲ |
| 2026-07-01 | 298.41 | ▲ |
| 2026-06-30 | 298.07 | ⚖️ |
| 2026-06-29 | 285.48 | ▼ |
| 2026-06-26 | 285.43 | ▼ |
The EMA analysis indicates a predominantly downward trend, with occasional pricing spikes indicating temporary reversals. The data suggests that the EMA20 is below the EMA50, reinforcing a bearish market sentiment.
Support and Resistance
| Zone | Range |
|---|---|
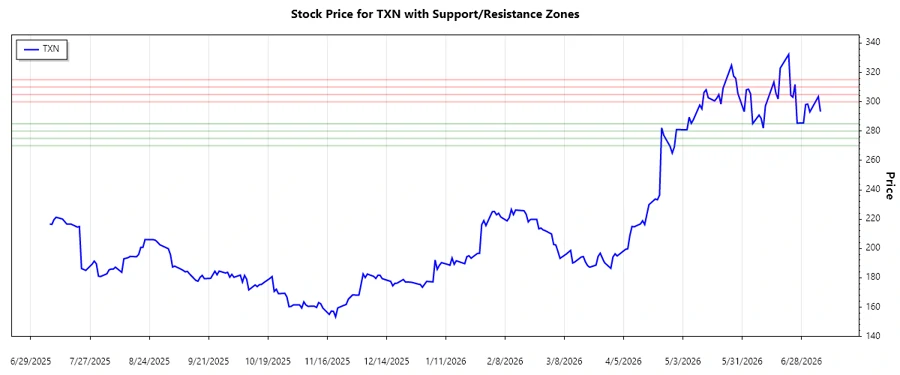
| Support Zone 1 | 🔽 280 - 285 |
| Support Zone 2 | 🔽 270 - 275 |
| Resistance Zone 1 | 🔼 300 - 305 |
| Resistance Zone 2 | 🔼 310 - 315 |
The current price situates itself closely to the first resistance zone, indicating potential further upward movement if broken. However, if sustained, the price may revert to the established support regions.
Conclusion
The analysis reveals that while there have been periods of upward momentum, the overarching trend is bearish. The stock is currently testing resistance levels, which could provide potential breakout opportunities but with inherent risks. Investors should watch for confirmed breaches of these zones to gauge entry points. The technical evaluation reflects the intricate balance between stock performance and market forces, necessitating vigilance for timely decision-making.
Smart Data Insight
Master the Perfect Entry & Exit for this Stock
Don't leave your profits to chance. Historically, this stock follows specific seasonal patterns that institutional traders use to maximize returns.
- ✅ Identify the "Golden Buying Window"
- ✅ Avoid high-risk correction cycles
- ✅ Backtested data from the last 20+ years