April 12, 2026 a 02:03 pm
TXN: Trend and Support & Resistance Analysis - Texas Instruments Incorporated
Texas Instruments Incorporated (TXN) has demonstrated considerable volatility in its recent price movements. Through comprehensive technical analysis, we aim to identify prevailing trends and key support and resistance levels. This analysis is crucial for evaluating potential investment opportunities or risks associated with TXN's stock. Investors should consider these insights in conjunction with macroeconomic factors impacting the semiconductor industry.
Trend Analysis
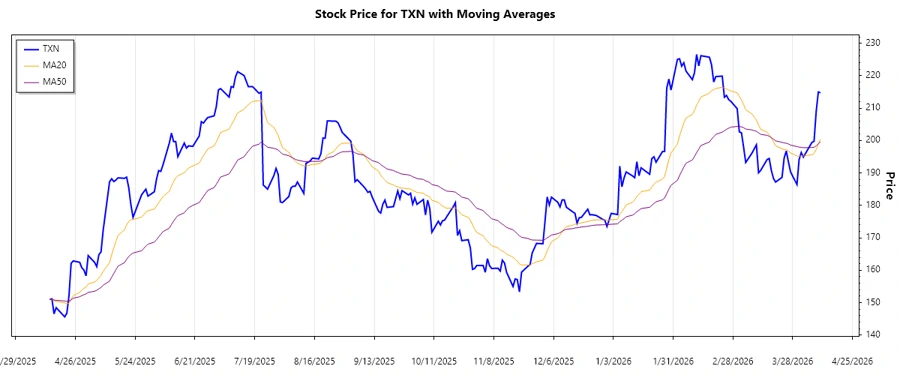
Based on the calculated EMAs over the period, we observe the following for Texas Instruments:
| Date | Close Price | Trend |
|---|---|---|
| April 10, 2026 | 214.73 | ▲ Uptrend |
| April 9, 2026 | 214.98 | ▲ Uptrend |
| April 8, 2026 | 208.9 | ▲ Uptrend |
| April 7, 2026 | 199.74 | ▲ Uptrend |
| April 6, 2026 | 199.42 | ▲ Uptrend |
| April 2, 2026 | 194.87 | ⚖️ Sideways |
| April 1, 2026 | 196.3 | ⚖️ Sideways |
Trend interpretation shows a predominant uptrend with the EMA20 having recently crossed above the EMA50. This indicates building momentum in TXN's price, although caution is warranted to watch for sustained support at higher levels.
Support and Resistance
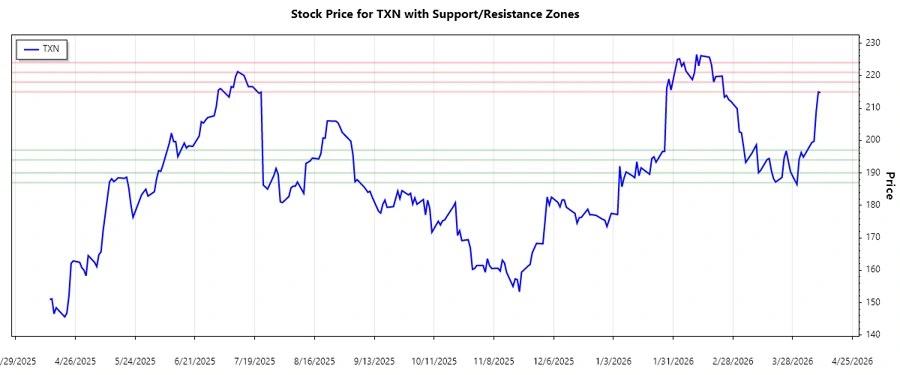
Identifying crucial support and resistance levels based on closing prices:
| Zone Type | From | To |
|---|---|---|
| Support Zone 1 | 187.00 | 190.00 |
| Support Zone 2 | 194.00 | 197.00 |
| Resistance Zone 1 | 215.00 | 218.00 |
| Resistance Zone 2 | 221.00 | 224.00 |
The current stock price is oscillating near the lower boundary of the first resistance zone, indicating a potential test or breakout. Traders should monitor how TXN behaves close to the 215-218 level for further insights.
Conclusion
The stock of Texas Instruments has shown resilience, supported by an evident uptrend, as indicated by our EMA analysis. If support levels hold, and resistance is breached, an upward trajectory could be sustained. However, global semiconductor market conditions remain a pivotal factor. Any unexpected downturn may prompt a reversal, as existing zones provide critical markers for price behavior. Thus, prudent and informed decision-making, adapting to both micro and macroeconomic conditions, is advised.