July 01, 2025 a 03:15 am

TXN: Trend and Support & Resistance Analysis - Texas Instruments Incorporated
Texas Instruments Incorporated (TXN) shows a dynamic growth pattern in its stock price, supported by its strong foothold in the semiconductor industry. The company operates successfully worldwide, offering a broad range of analog and embedded processing products. With consistent innovation and a solid business model, TXN has maintained stability amidst market fluctuations. Its current trend and technical indicators provide investors with insights into potential entry and exit points. Identifying support and resistance levels further supports strategic trading decisions.
Trend Analysis
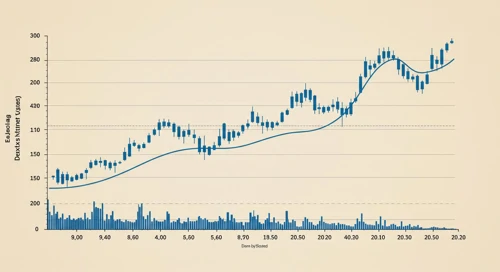
The stock of Texas Instruments (TXN) has displayed significant price movements over the past months, suggesting a trend that can be analyzed by the exponential moving averages (EMAs). The short-term EMA (20-day) is compared to the long-term EMA (50-day) to determine the current trend direction.
| Date | Closing Price | Trend |
|---|---|---|
| 2025-06-30 | 207.62 | ▲ |
| 2025-06-27 | 207.08 | ▲ |
| 2025-06-26 | 206.31 | ▲ |
| 2025-06-25 | 205.38 | ▲ |
| 2025-06-24 | 205.81 | ▲ |
| 2025-06-23 | 201.39 | ▲ |
| 2025-06-20 | 198.2 | ▲ |
The above table illustrates a clear ▲ upward trend, which is further confirmed by the relationship between EMA20 and EMA50. Therefore, investors might consider this as a positive sign for a continuing upward price movement.
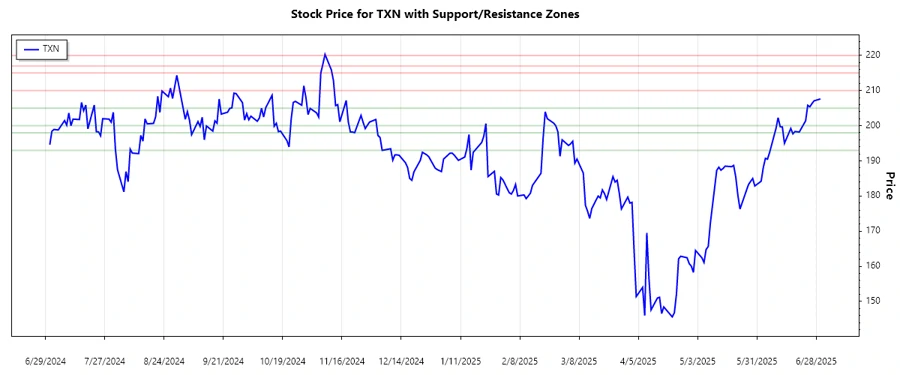
Support and Resistance
Identifying key support and resistance levels is critical for understanding the potential price reversals and continuation points.
| Zone Type | From | To |
|---|---|---|
| Support | 193.00 | 198.00 |
| Support | 200.00 | 205.00 |
| Resistance | 210.00 | 215.00 |
| Resistance | 217.00 | 220.00 |
Currently, the price of TXN resides just above the support zone of 200.00 - 205.00. If the support holds, it might lead to a bullish trend continuation. On the contrary, if it breaks, there could be a downside movement towards the next support level.
Conclusion
In conclusion, Texas Instruments' (TXN) stock exhibits a distinctly bullish trend as per EMA analysis, presenting a good opportunity for potential gains in the short term. However, considering the critical support and resistance levels, traders should be observant of price actions near these zones. The company's strong operational framework in the semiconductor market further bolsters its growth potential. Nevertheless, external factors, such as global market conditions or changes in semiconductor demand, should be considered as potential risks. Hence, while TXN presents an inviting prospect for investment, caution and informed decisions are advised.
Smart Data Insight
Master the Perfect Entry & Exit for this Stock
Don't leave your profits to chance. Historically, this stock follows specific seasonal patterns that institutional traders use to maximize returns.
- ✅ Identify the "Golden Buying Window"
- ✅ Avoid high-risk correction cycles
- ✅ Backtested data from the last 20+ years