March 07, 2026 a 05:15 am
TXN: Fibonacci Analysis - Texas Instruments Incorporated
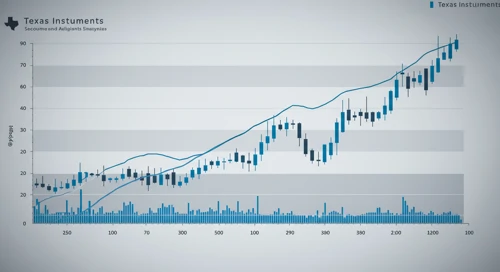
Texas Instruments Inc. (TXN) has shown resilience in the semiconductor industry, catering to global electronics designers and manufacturers. As the company continues to capitalize on its diverse product offering, it remains a notable player in both the Analog and Embedded Processing market segments. Investors should observe the price movements closely as TXN navigates potential market volatilities.
Fibonacci Analysis
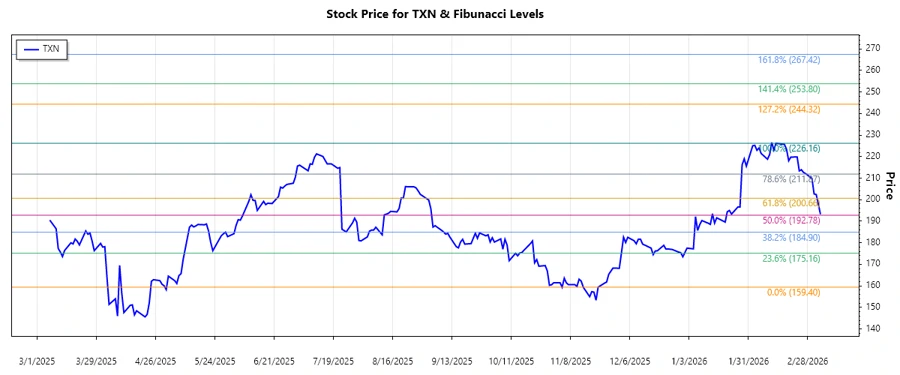
Analyzing the historical price data reveals a dominant uptrend in the stock over recent months. By examining the price movements from the low of mid-October 2025 to the recent high in mid-February 2026, we computed the crucial Fibonacci retracement levels to observe potential support and resistance areas.
| Start Date | End Date | High Price | Low Price |
|---|---|---|---|
| 2025-10-13 | 2026-02-13 | $226.16 (2026-02-13) | $159.4 (2025-11-21) |
| Retracement Level | Price |
|---|---|
| 0.236 | $206.96 |
| 0.382 | $197.16 |
| 0.5 | $192.78 |
| 0.618 | $188.40 |
| 0.786 | $182.42 |
Currently, the stock trades around $193.23, which is near the 0.5 retracement level, indicating potential support at this price point.
Technically, the 0.5 level can act as a strong support if the stock reverses upward. Further price action should confirm whether this level holds or if lower levels are to be tested.
Conclusion
In conclusion, while Texas Instruments' stock has recently retraced from its highs, the identified Fibonacci levels suggest potential areas of support in the near future. Analysts should monitor these levels closely to identify potential buying opportunities or recognize signs of further weakening. Market volatility and semiconductor industry dynamics are key factors influencing TXN's stock price. Investors should remain attentive to global semiconductor demand and technological advancements, as they weigh the risks of volatility against the growth potential of Texas Instruments.