November 24, 2025 a 04:44 pm
TXN: Fibonacci Analysis - Texas Instruments Incorporated
Texas Instruments Incorporated has shown significant movement in its semiconductor business, providing diverse products for various electronics requirements. As a dominant player in the global market, its recent price actions can offer insights for potential trading opportunities. With a notable shift in trend, investors should consider technical frameworks such as Fibonacci retracement to assess potential market behavior.
Fibonacci Analysis
| Parameter | Details |
|---|---|
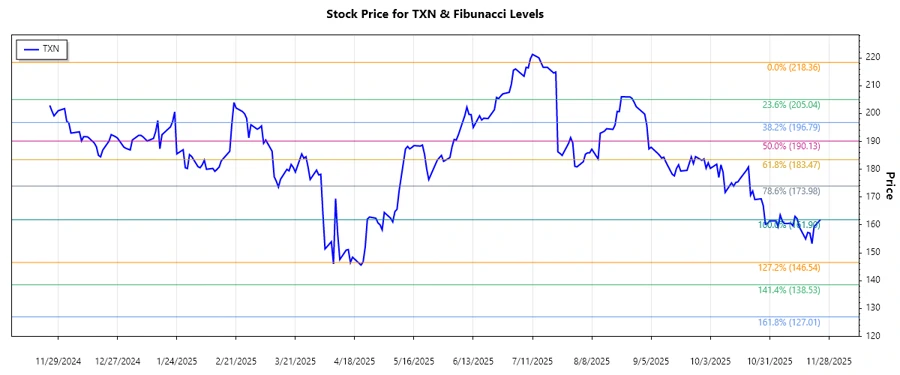
| Trend Period | 2025-07-15 to 2025-11-24 |
| High (Date & Price) | 2025-07-15, $218.36 |
| Low (Date & Price) | 2025-11-24, $161.90 |
| Fibonacci Levels |
|
| Current Price Position | The current price of $161.90 is below the 0.236 level, not within the retracement zone. |
| Technical Interpretation | The current price suggests the trend might continue downward unless it breaks above the 0.236 level, which may then offer resistance. |
Conclusion
Texas Instruments has shown a significant downtrend, reflecting broader market conditions and sector-specific challenges. The current price indicates that the stock remains outside its Fibonacci retracement levels, suggesting potential further downside. However, should market conditions improve, and the stock sees increased buying pressure, the Fibonacci levels could act as strong resistance points. Investors should remain cautious while monitoring market indicators that could provide bullish confirmation. A comprehensive analysis could entail examining macroeconomic factors and Texas Instruments' strategic initiatives within the semiconductor space.
Smart Data Insight
Master the Perfect Entry & Exit for this Stock
Don't leave your profits to chance. Historically, this stock follows specific seasonal patterns that institutional traders use to maximize returns.
- ✅ Identify the "Golden Buying Window"
- ✅ Avoid high-risk correction cycles
- ✅ Backtested data from the last 20+ years