August 07, 2025 a 11:45 am

TXN: Fibonacci Analysis - Texas Instruments Incorporated
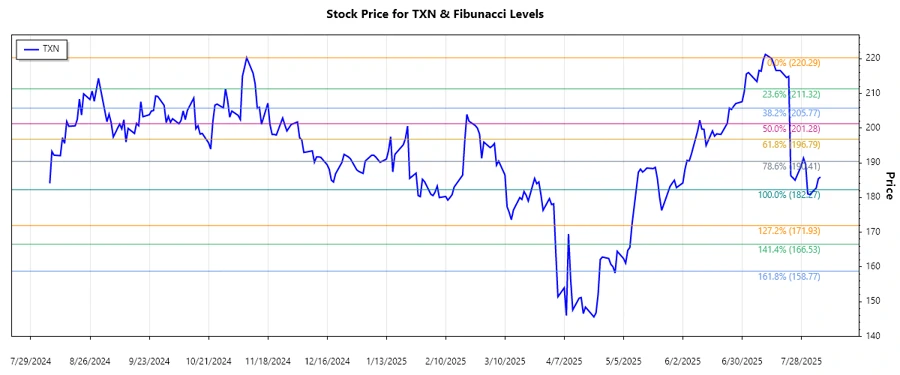
Texas Instruments Incorporated (TXN) has recently shown a bearish trend, with prices trending downwards over the past months. The semiconductor giant, known for its strong market presence in analog and embedded processing segments, has seen its stock value diminish due to market dynamics and sector pressures. As an investor, understanding the current retracement levels is crucial to determine potential reversal points or further continuation of this trend.
Fibonacci Analysis
Data Overview
| Parameter | Details |
|---|---|
| Trend Start Date | 2024-11-08 |
| Trend End Date | 2025-07-18 |
| High Price | $220.29 on 2024-11-08 |
| Low Price | $182.27 on 2025-05-09 |
Fibonacci Levels
| Level | Price |
|---|---|
| 0.236 | $191.11 |
| 0.382 | $196.43 |
| 0.5 | $201.28 |
| 0.618 | $206.13 |
| 0.786 | $213.17 |
The current price level is at $185.91, which indicates it is not currently within a significant Fibonacci retracement before the next trading move. A potential support area is indicated at the 0.236 level, around $191.11. Should prices break below $182.27, this could confirm the continuation of the downward trend.
Conclusion
Texas Instruments stock is in a precarious position where a break below significant support levels could lead to further declines. The identified Fibonacci levels suggest potential areas of support and resistance, with $191.11 serving as a near-term support. However, the stock must climb past $206.13 to signal a potential reversal. Investors should keep a keen eye on external factors affecting the semiconductor market and monitor news for any shifts in Texas Instruments' business strategy or operational outlook, which could impact the stock trajectory. While bearish pressures are present, a strategic entry at support levels might present a recovery opportunity.
Smart Data Insight
Master the Perfect Entry & Exit for this Stock
Don't leave your profits to chance. Historically, this stock follows specific seasonal patterns that institutional traders use to maximize returns.
- ✅ Identify the "Golden Buying Window"
- ✅ Avoid high-risk correction cycles
- ✅ Backtested data from the last 20+ years