
June 06, 2026 a 03:31 pm

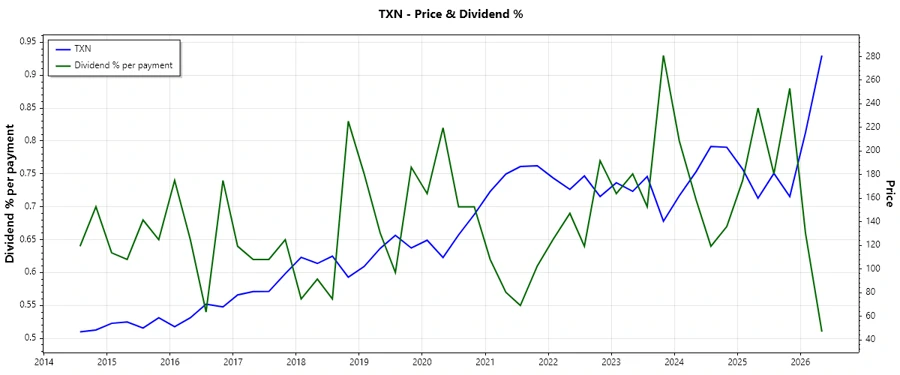
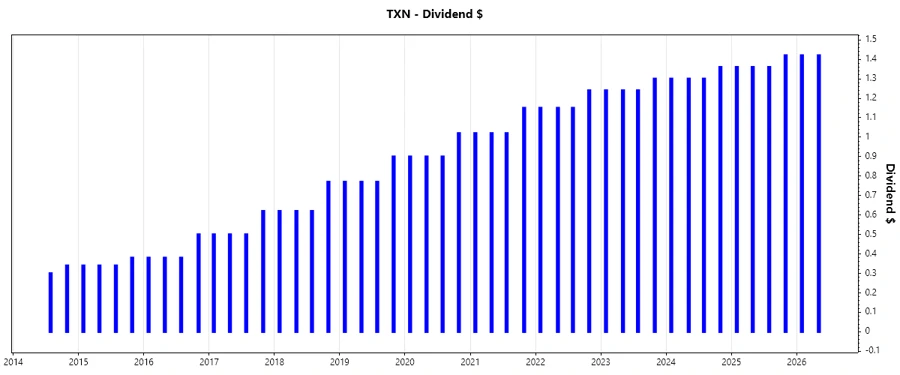

TXN: Dividend Analysis - Texas Instruments Incorporated
Texas Instruments Incorporated has a robust dividend profile, marked by consistency and growth. With a remarkable 55-year history of dividend payments, TXN demonstrates stability and resilience in volatile markets. Despite a relatively high payout ratio, the company showcases a steady cash flow, supporting its dividends.
📊 Overview
The financial landscape of Texas Instruments is illuminated by its sector position and dividend data. TXN operates within a lasting tradition of shareholder returns through dividends, a key focus for many investors.
| Metric | Value |
|---|---|
| Sector | Technology |
| Dividend Yield | 2% |
| Current Dividend Per Share | $5.50 |
| Dividend History | 55 years |
| Last Cut or Suspension | None |
📈 Dividend History
Understanding the dividend history provides insights into the consistency and reliability of payout strategies. This track record attracts income-focused investors.
| Year | Dividend Per Share (USD) |
|---|---|
| 2026 | $2.84 |
| 2025 | $5.50 |
| 2024 | $5.26 |
| 2023 | $5.02 |
| 2022 | $4.69 |
📈 Dividend Growth
Analyzing dividend growth reveals how Texas Instruments manages its shareholder returns over time. The growth rates over three and five years highlight its performance trajectory.
| Time | Growth |
|---|---|
| 3 years | 5.45% |
| 5 years | 8.13% |
The average dividend growth is 8.13% over 5 years. This shows moderate but steady dividend growth.
📈 Payout Ratio
The payout ratios are crucial in assessing whether dividend payments are sustainable in the long run. High ratios might signal potential risk in maintaining current dividend levels.
| Key Figure | Ratio |
|---|---|
| EPS-based | 93.14% |
| Free Cash Flow-based | 134.51% |
The EPS payout ratio of 93.14% and the Free Cash Flow payout ratio of 134.51% suggest a potential strain on future dividend sustainability, indicating careful monitoring is necessary.
🗣️ Cashflow & Capital Efficiency
Evaluating cash flow and capital efficiency helps determine financial health and the ability to support operational needs.
| Metric | 2023 | 2024 | 2025 |
|---|---|---|---|
| Free Cash Flow Yield | 0.0087 | 0.0088 | 0.0165 |
| Earnings Yield | 0.0421 | 0.0281 | 0.0317 |
| CAPEX to Operating Cash Flow | 0.7899 | 0.7629 | 0.6361 |
| Stock-based Compensation to Revenue | 0.0207 | 0.0247 | 0.0237 |
| Free Cash Flow / Operating Cash Flow Ratio | 0.2101 | 0.2371 | 0.3639 |
The evaluated metrics suggest a solid cash flow management but highlight the need for improving cash flow coverage to bolster dividend payments.
💼 Balance Sheet & Leverage Analysis
A detailed examination of leverage and liquidity ratios reveals the company's ability to meet its financial commitments.
| Metric | 2023 | 2024 | 2025 |
|---|---|---|---|
| Debt-to-Equity | 0.726 | 0.890 | 0.946 |
| Debt-to-Assets | 0.379 | 0.424 | 0.445 |
| Debt-to-Capital | 0.421 | 0.471 | 0.486 |
| Net Debt to EBITDA | 1.033 | 1.570 | 1.474 |
| Current Ratio | 0 | 0 | 0 |
| Quick Ratio | 3.350 | 2.882 | 2.832 |
| Financial Leverage | 1.914 | 2.101 | 2.125 |
The leverage ratios reflect a progressively increasing debt profile, necessitating strategic oversight to maintain financial stability.
📈 Fundamental Strength & Profitability
Key profitability and return metrics illustrate the efficiency in using shareholder capital to generate earnings.
| Metric | 2023 | 2024 | 2025 |
|---|---|---|---|
| Return on Equity | 38.53% | 28.39% | 30.73% |
| Return on Assets | 20.12% | 13.51% | 14.46% |
| Net Margin | 37.16% | 30.68% | 28.28% |
| EBIT Margin | 44.36% | 38.11% | 35.36% |
| EBITDA Margin | 51.42% | 48.21% | 46.67% |
| Gross Margin | 62.90% | 58.14% | 57.02% |
| R&D to Revenue | 10.63% | 12.52% | 11.78% |
While profitability ratios remain robust, declining trends signal the necessity for strategic improvement to maintain strong fundamentals.
📉 Price Development
✅ Dividend Scoring System
| Category | Score | |
|---|---|---|
| Dividend Yield | 3 | |
| Dividend Stability | 5 | |
| Dividend Growth | 4 | |
| Payout Ratio | 2 | |
| Financial Stability | 4 | |
| Dividend Continuity | 5 | |
| Cashflow Coverage | 3 | |
| Balance Sheet Quality | 3 |
Total Score: 29/40
🗣️ Rating
Texas Instruments Incorporated ranks as a solid choice for dividend investors seeking stable returns with moderate growth potential. However, vigilance in monitoring the payout ratio and debt levels is advised to ensure sustained dividend health.
Smart Data Insight
Master the Perfect Entry & Exit for this Stock
Don't leave your profits to chance. Historically, this stock follows specific seasonal patterns that institutional traders use to maximize returns.
- ✅ Identify the "Golden Buying Window"
- ✅ Avoid high-risk correction cycles
- ✅ Backtested data from the last 20+ years