May 08, 2026 a 03:31 am

TXN: Dividend Analysis - Texas Instruments Incorporated
Texas Instruments Incorporated stands as a pillar in the semiconductor industry, consistently delivering robust dividends over the years. With a stable dividend yield of 2%, TXN provides reliable income to investors. Its 55-year dividend history underscores a commitment to shareholder returns, making it an attractive choice for income-focused portfolios.
📊 Overview
Texas Instruments operates within the dynamic Technology sector. Its current dividend yield of 2% is modest but underscores a reliable source of income for investors. With a long-standing dividend history of 55 years, TXN has demonstrated unwavering commitment to returning capital to shareholders. Moreover, the company has maintained its dividend without any recent cuts or suspensions.
| Detail | Value |
|---|---|
| Sector | Technology |
| Dividend Yield | 2% |
| Current Dividend per Share | $5.50 |
| Dividend History | 55 years |
| Last Cut or Suspension | None |
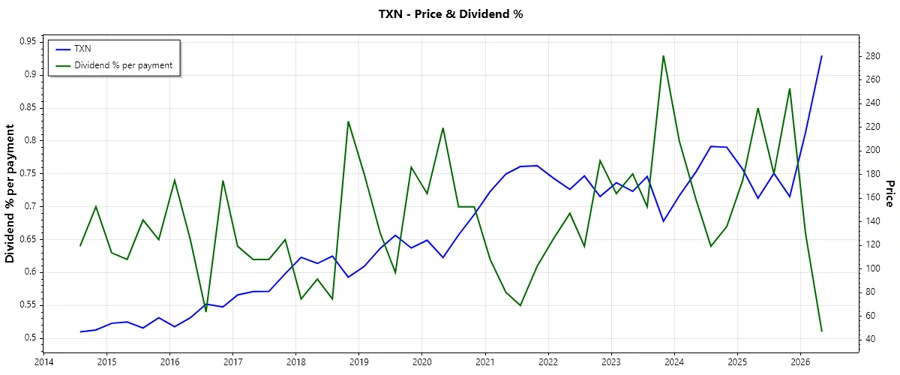
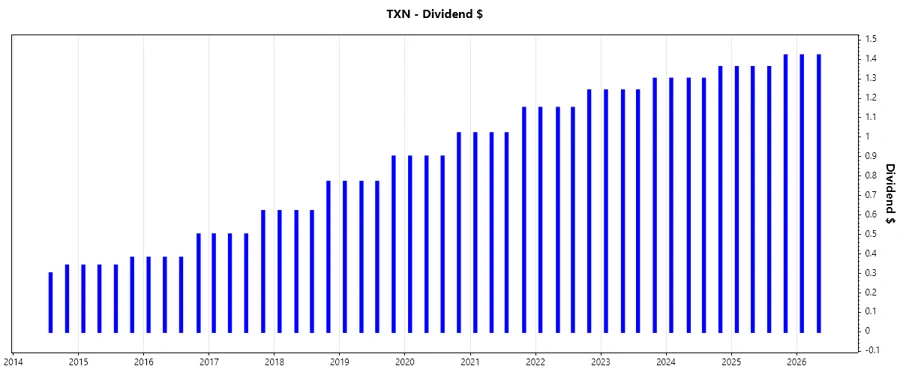
📉 Dividend History
The rich dividend history of Texas Instruments is a testament to its financial stability and consistent performance. This historical resilience is particularly important for investors seeking reliability and predictability in income.
| Year | Dividend per Share (USD) |
|---|---|
| 2026 | 2.84 |
| 2025 | 5.50 |
| 2024 | 5.26 |
| 2023 | 5.02 |
| 2022 | 4.69 |
📈 Dividend Growth
The analysis of dividend growth reveals TXN's capacity to increase shareholder wealth over time. A steady dividend growth rate is crucial for combating inflation and enhancing total returns.
| Time | Growth |
|---|---|
| 3 years | 5.5% |
| 5 years | 8.1% |
The average dividend growth is 8.1% over 5 years. This shows moderate but steady dividend growth.
✅ Payout Ratio
The payout ratio highlights how much of the company's earnings and cash flow is given back to shareholders as dividends. High payout ratios can signal sustainability concerns for dividend payouts.
| Key figure | Ratio |
|---|---|
| EPS-based | 93.1% |
| Free cash flow-based | 134.5% |
With a payout ratio of 93.1% based on EPS and 134.5% based on FCF, TXN significantly returns its earnings to shareholders. While the EPS ratio is approaching a sustainable limit, the FCF ratio exceeds it, which could flag concerns for future dividend growth if cash flow doesn't increase.
📊 Cashflow & Capital Efficiency
Understanding Texas Instruments' cashflow metrics and capital allocation efficiency is crucial for assessing its long-term financial health and the capacity to sustain dividends.
| Metric | 2023 | 2024 | 2025 |
|---|---|---|---|
| Free Cash Flow Yield | 0.9% | 0.9% | 1.7% |
| Earnings Yield | 4.2% | 2.8% | 3.1% |
| CAPEX to Operating Cash Flow | 78.9% | 76.3% | 63.6% |
| Stock-based Compensation to Revenue | 2.1% | 2.5% | 2.4% |
| Free Cash Flow / Operating Cash Flow Ratio | 21.0% | 23.7% | 36.4% |
Overall, the free cash flow ratios indicate a consistent growth in financial capacity to cover dividend payments, although a continued focus on capital efficiency is necessary.
📏 Balance Sheet & Leverage Analysis
Assessing balance sheet metrics gives insights into the leverage and liquidity structure, which impacts dividend sustainability and financial flexibility.
| Ratio | 2023 | 2024 | 2025 |
|---|---|---|---|
| Debt-to-Equity | 0.73 | 0.89 | 0.95 |
| Debt-to-Assets | 0.38 | 0.42 | 0.45 |
| Debt-to-Capital | 0.42 | 0.47 | 0.49 |
| Net Debt to EBITDA | 1.03 | 1.57 | 1.47 |
| Current Ratio | 4.55 | 4.12 | 4.35 |
| Quick Ratio | 3.35 | 2.88 | 2.83 |
| Financial Leverage | 1.91 | 2.10 | 2.13 |
The slight increase in leverage ratios over the years warrants attention, though the company maintains solid liquidity ratios indicative of financial resilience.
📈 Fundamental Strength & Profitability
These metrics illuminate TXN's ability to generate profit relative to its equity, assets, and invested capital. A high return on equity indicates effective management and strong earnings power.
| Metric | 2023 | 2024 | 2025 |
|---|---|---|---|
| Return on Equity | 38.5% | 28.4% | 30.7% |
| Return on Assets | 20.1% | 13.5% | 14.5% |
| Margins: Net | 37.2% | 30.7% | 28.3% |
| Margins: EBIT | 44.4% | 38.1% | 35.4% |
| Margins: EBITDA | 51.4% | 48.2% | 46.7% |
| Margins: Gross | 62.9% | 58.1% | 57.0% |
| R&D to Revenue | 10.6% | 12.5% | 11.8% |
Positive trends in ROE and margin profiles suggest continued operational efficiency and profitability, reinforcing TXN's shareholder value proposition.
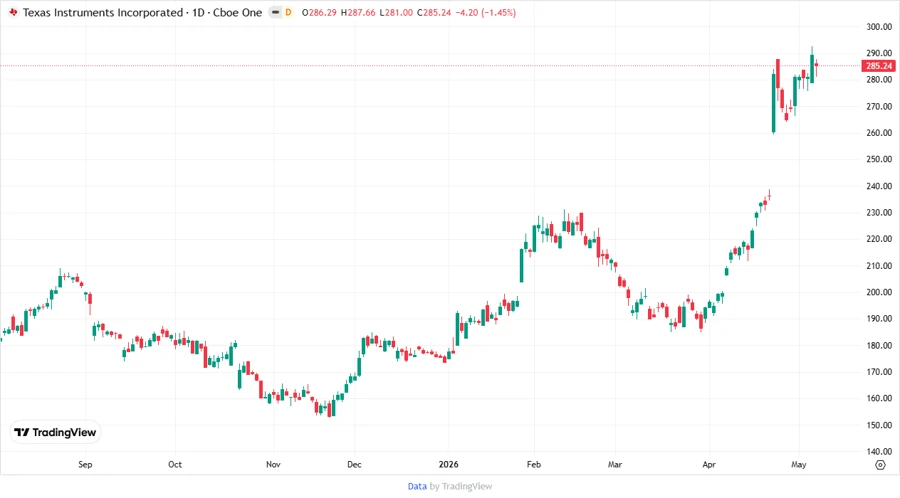
🗣️ Price Development
📋 Dividend Scoring System
| Criteria | Score | Indicator |
|---|---|---|
| Dividend Yield | 3 | |
| Dividend Stability | 5 | |
| Dividend Growth | 4 | |
| Payout Ratio | 3 | |
| Financial Stability | 4 | |
| Dividend Continuity | 5 | |
| Cashflow Coverage | 3 | |
| Balance Sheet Quality | 4 |
Total Score: 31/40
🗣️ Rating
Texas Instruments Incorporated is a solid dividend performer with a clearly defined history of delivering value through regular payouts and growth. Despite high payout ratios, the company's robust financial metrics assure dividend continuity. It merits strong consideration for income investors, especially those valuing stability and sustained growth potential.
Smart Data Insight
Master the Perfect Entry & Exit for this Stock
Don't leave your profits to chance. Historically, this stock follows specific seasonal patterns that institutional traders use to maximize returns.
- ✅ Identify the "Golden Buying Window"
- ✅ Avoid high-risk correction cycles
- ✅ Backtested data from the last 20+ years