
July 01, 2026 a 10:15 am
TTWO: Fibonacci Analysis - Take-Two Interactive Software, Inc.
Take-Two Interactive Software, Inc. (TTWO) has shown a strong performance recently with a notable uptrend. The company benefits from a diverse range of gaming products and robust distribution channels. With strategic releases and a strong brand presence, TTWO is well-positioned to continue its growth trajectory, though market volatility and competition in the tech sector remain key considerations for investors.
Fibonacci Analysis
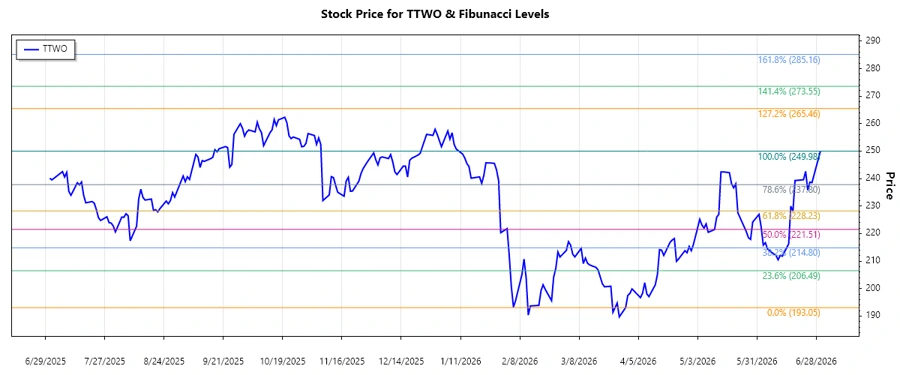
The recent upward trend for TTWO stock spans from March 23, 2026, to June 30, 2026. The stock reached a low of $193.05 on March 25, 2026, and peaked at $249.98 on June 30, 2026. Based on this trend, the calculated Fibonacci Retracement Levels are as follows:
| Level | Price |
|---|---|
| 0.236 | $235.44 |
| 0.382 | $227.94 |
| 0.5 | $221.52 |
| 0.618 | $215.10 |
| 0.786 | $206.56 |
Currently, the TTWO stock price sits at $249.98, which is above all retracement levels, indicating it is not in a retracement zone. Technically, this suggests the stock maintains strong upward momentum, and these levels can act as future support zones if the price begins to retrace.
Conclusion
Take-Two Interactive Software, Inc., with its impressive portfolio and strategic market positioning, continues to show strong forward momentum. The lack of retracement into Fibonacci levels could point to further upside potential, although the stock's high price calls for caution as it might invite selling pressure. Analysts could view current levels as an opportunity for tracking breakout potential or consider these Fibonacci levels as preliminary support zones for potential pullbacks. Given the highly competitive gaming sector, agility and consistent innovation remain critical for sustaining Take-Two's upward trajectory.
Smart Data Insight
Master the Perfect Entry & Exit for this Stock
Don't leave your profits to chance. Historically, this stock follows specific seasonal patterns that institutional traders use to maximize returns.
- ✅ Identify the "Golden Buying Window"
- ✅ Avoid high-risk correction cycles
- ✅ Backtested data from the last 20+ years