March 14, 2026 a 11:44 am
TTWO: Fibonacci Analysis - Take-Two Interactive Software, Inc.
Take-Two Interactive Software, Inc. has shown a recent downtrend in its stock price, reflecting market volatility or potential industry-specific challenges. The decline might concern investors, but strategic acquisitions and the company's strong portfolio could serve as a foundation for a future rebound.
Fibonacci Analysis
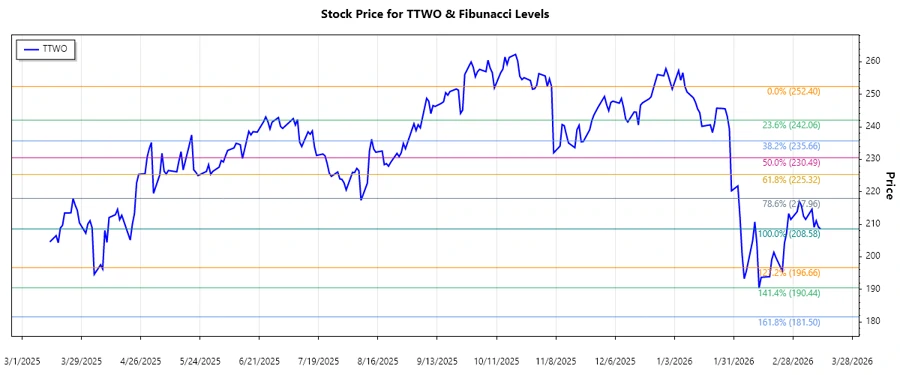
The recent trend analyzed for Take-Two Interactive Software, Inc. (TTWO) reveals a dominant downtrend. This trend forms the basis for the following Fibonacci Retracement analysis.
| Detail | Value |
|---|---|
| Trend Start Date | 2025-11-06 |
| Trend End Date | 2026-03-13 |
| High (Date/Price) | 2025-11-06 / $252.40 |
| Low (Date/Price) | 2026-03-13 / $208.58 |
| Fibonacci Level | Price Level |
|---|---|
| 0.236 | $242.35 |
| 0.382 | $237.16 |
| 0.5 | $230.49 |
| 0.618 | $223.82 |
| 0.786 | $214.88 |
As of the last data point, the current price is at $208.58, which is below the 0.786 Fibonacci retracement level. Hence, it is not in any current retracement zone.
Technically, breaking below the 0.786 level suggests a possible continuation of the downtrend unless a reversal pattern occurs soon.
Conclusion
Take-Two Interactive Software, Inc. is currently in a downtrend, indicating potential risks for investors. Although the price sits below the 0.786 Fibonacci level, the company's robust game portfolio and potential growth in digital markets remain promising for its long-term outlook. However, investors should be cautious and consider market trends and industry updates when making investment decisions. Technical indicators suggest potential further decline unless there's a bullish reversal, making it essential to monitor the stock's movement closely.