July 05, 2026 a 01:15 pm

TTD: Trend and Support & Resistance Analysis - The Trade Desk, Inc.
The Trade Desk, Inc. has been experiencing a volatile market with noticeable trends in its pricing over the past months. As a global technology company involved in digital advertising, market factors heavily influence its stock liquidity and valuation. Recent data suggests a notable trend which investors must consider in their financial decisions.
Trend Analysis
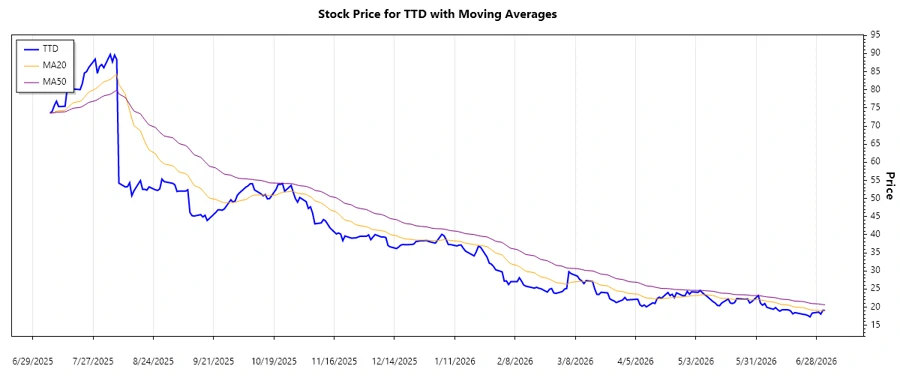
The recent trend for The Trade Desk, Inc. over the last months demonstrates a downward trajectory when evaluating the comparative moving averages. Specifically, the calculated EMA20 and EMA50 indicate a bearish movement.
| Date | Close Price | Trend |
|---|---|---|
| 2026-07-02 | 19.10 | ▼ |
| 2026-07-01 | 19.15 | ▼ |
| 2026-06-30 | 18.08 | ▼ |
| 2026-06-29 | 18.65 | ▼ |
| 2026-06-26 | 18.37 | ▼ |
| 2026-06-25 | 17.33 | ▼ |
| 2026-06-24 | 17.70 | ▼ |
Based on the trend analysis and EMA calculations, The Trade Desk, Inc. is currently experiencing a strong bearish trend, with no immediate signs of reversal.
Support and Resistance
The price data for The Trade Desk, Inc. reveals potential zones where support and resistance are expected. These zones help in identifying where the stock might find buying or selling pressure.
| Zone | Range | Description |
|---|---|---|
| Support 1 | 17.00 - 18.00 | ---- |
| Support 2 | 18.50 - 19.00 | ---- |
| Resistance 1 | 19.50 - 20.00 | ++++ |
| Resistance 2 | 20.50 - 21.00 | ++++ |
The current price of The Trade Desk, Inc. is close to the lower support zones, indicating potential buying opportunities for investors.
Conclusion
The Trade Desk, Inc. shows an ongoing bearish trend. However, the proximity to support zones indicates potential stabilization and future upward pressure if the market conditions shift favorably. Analysts must monitor market sentiment and broader digital advertising trends for signals of significant change. The risk remains in the broader economic influences impacting the technology and digital advertising sectors.
Smart Data Insight
Master the Perfect Entry & Exit for this Stock
Don't leave your profits to chance. Historically, this stock follows specific seasonal patterns that institutional traders use to maximize returns.
- ✅ Identify the "Golden Buying Window"
- ✅ Avoid high-risk correction cycles
- ✅ Backtested data from the last 20+ years