
June 28, 2026 a 02:03 pm
TTD: Trend and Support & Resistance Analysis - The Trade Desk, Inc.
The Trade Desk, Inc. has shown significant volatility in the market over the past few months. The recent trend indicates a downward pressure on the stock price, suggesting caution for potential investors. As a global technology company, TTD's performance is tied to the health of the digital advertising market. Investors should consider market trends and TTD's innovation capability in cloud-based platforms. With the digital ad market evolving constantly, how The Trade Desk adapts will be crucial.
Trend Analysis
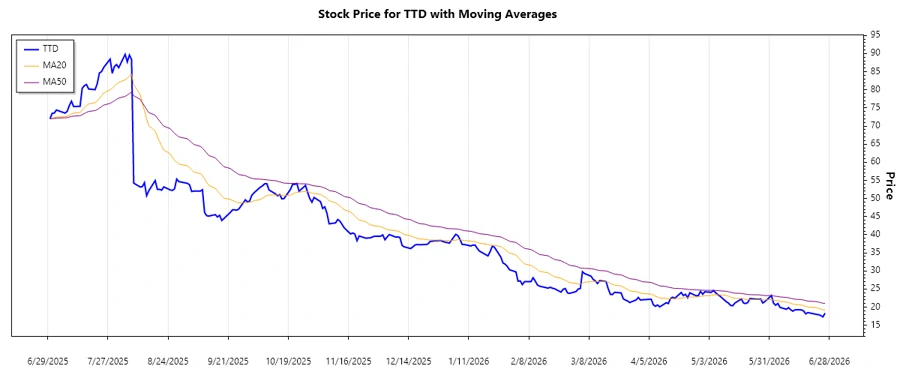
The calculation using EMA20 and EMA50 indicates a consistent downward trend in the last months of the observed period.
| Date | Close Price | Trend |
|---|---|---|
| 2026-06-26 | 18.37 | ▼ |
| 2026-06-25 | 17.33 | ▼ |
| 2026-06-24 | 17.7 | ▼ |
| 2026-06-23 | 17.93 | ▼ |
| 2026-06-22 | 18.02 | ▼ |
| 2026-06-18 | 18.51 | ▼ |
| 2026-06-17 | 18.16 | ▼ |
Given the EMA trends, the stock is showing consistent downward pressure.
Support- and Resistance
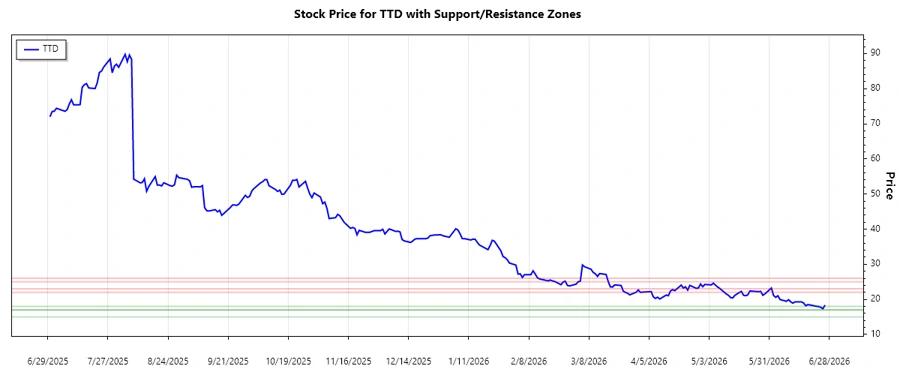
Examination of historical data reveals key support and resistance zones:
| Type | Zone From | Zone To |
|---|---|---|
| Support | 17.00 | 18.00 |
| Support | 15.00 | 17.00 |
| Resistance | 22.00 | 23.00 |
| Resistance | 25.00 | 26.00 |
The stock is currently hovering around the lower support zone, indicating potential further downside risk.
Conclusion
The Trade Desk's stock has seen a bearish trend with support zones being tested strongly. The resistance levels identified are significantly higher than the current trading range, suggesting that upward movements may face considerable challenges. Potential investors should weigh the current trend against their risk tolerance. While the digital ad market continues to grow, TTD's ability to innovate remains critical. However, caution is advised due to market volatility and external economic factors impacting the advertising industry.
Smart Data Insight
Master the Perfect Entry & Exit for this Stock
Don't leave your profits to chance. Historically, this stock follows specific seasonal patterns that institutional traders use to maximize returns.
- ✅ Identify the "Golden Buying Window"
- ✅ Avoid high-risk correction cycles
- ✅ Backtested data from the last 20+ years