October 10, 2025 a 01:15 pm


TTD: Trend and Support & Resistance Analysis - The Trade Desk, Inc.
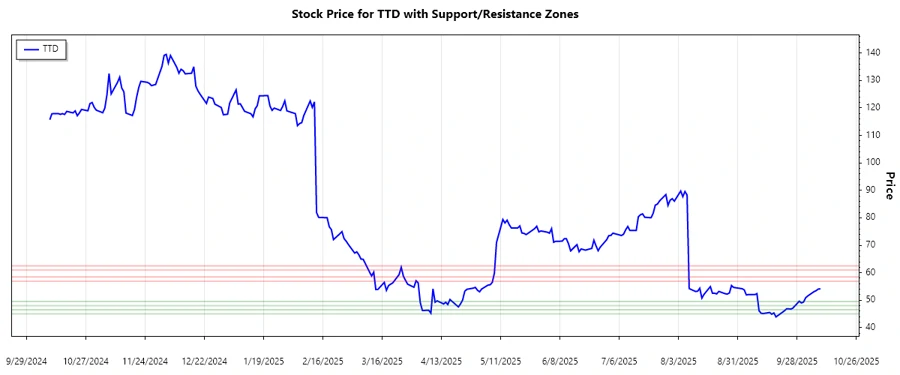
The Trade Desk, Inc. has demonstrated volatility in the stock market, marked by periods of significant upswings and downturns. As a leader in digital advertising technology, its stock is influenced by market sentiment, industry trends, and overall economic conditions. The most recent data indicates a potentially emerging trend that could impact investor strategies. This analysis delves into the current technical indicators and historical price action to provide a deeper understanding of potential price movements.
Trend Analysis
| Date | Close Price | Trend |
|---|---|---|
| 2025-10-09 | $54.09 | ▲ |
| 2025-10-08 | $54.07 | ▲ |
| 2025-10-07 | $53.49 | ▲ |
| 2025-10-06 | $53.14 | ▲ |
| 2025-10-03 | $51.55 | ▲ |
| 2025-10-02 | $50.88 | ▼ |
| 2025-10-01 | $49.32 | ▼ |
Based on the EMA calculations, the recent trend indicates a short-term ▲ uptrend. This suggests growing positive sentiment, leveraging The Trade Desk's technology-driven market position to stimulate investor interest.
Support and Resistance
| Zone | Price Range |
|---|---|
| Resistance 1 | $56.90 - $58.50 ▲ |
| Resistance 2 | $61.00 - $62.50 ▲ |
| Support 1 | $48.00 - $49.50 ▼ |
| Support 2 | $45.00 - $46.50 ▼ |
The current price action places TTD in close proximity to its immediate resistance zone. A break above this could signify a continuation of the uptrend, while failure to breach could lead to a reversal.
Conclusion
The Trade Desk, Inc.'s stock is experiencing an upward momentum, with potential resistance at the current price levels. This presents opportunities for bullish investors, anticipating a break through resistance zones. However, analysts should also take into account macroeconomic factors and market sentiment that could trigger increased volatility. A significant breach beyond the resistance could signal continued growth, whereas stability or decline within the support zones could require a cautious approach. Overall, TTD remains a dynamic stock with potential for both remarkable gains and notable risks.
Smart Data Insight
Master the Perfect Entry & Exit for this Stock
Don't leave your profits to chance. Historically, this stock follows specific seasonal patterns that institutional traders use to maximize returns.
- ✅ Identify the "Golden Buying Window"
- ✅ Avoid high-risk correction cycles
- ✅ Backtested data from the last 20+ years