
July 16, 2026 a 10:15 am
TTD: Fibonacci Analysis - The Trade Desk, Inc.
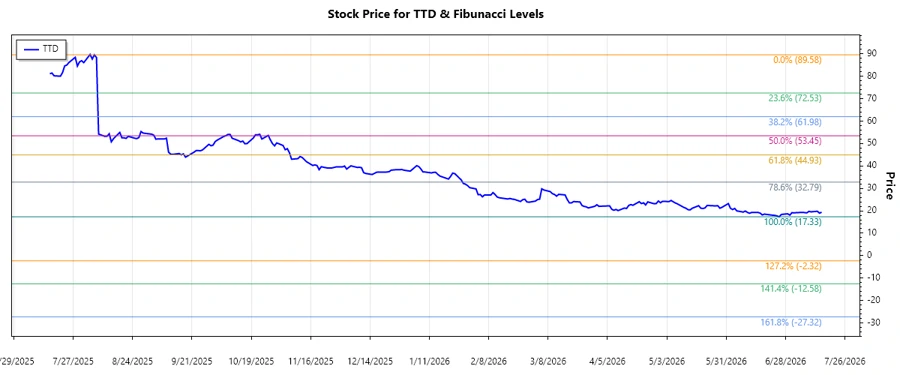
The Trade Desk, Inc. (TTD) has shown significant price movement in the past months. After reaching a peak in early 2025, the stock experienced a substantial decline, indicating a strong downtrend. Traders should pay attention to potential reversal signals as the stock currently sits in a critical retracement zone. These retracement levels could serve as both support and resistance in the upcoming trading sessions.
Fibonacci Analysis
| Data Points | Values |
|---|---|
| Trend Start Date | 2025-08-06 |
| Trend End Date | 2026-07-15 |
| High Price & Date | $89.58 on 2025-08-06 |
| Low Price & Date | $17.33 on 2026-06-25 |
| Fibonacci Level | Price Level |
|---|---|
| 0.236 | $37.01 |
| 0.382 | $46.34 |
| 0.5 | $53.46 |
| 0.618 | $60.59 |
| 0.786 | $70.35 |
The current price of $19.37 is below the 0.236 retracement level, indicating that the stock is not within a retracement area and potentially signaling further continuation of the downtrend.
Technically, the 0.236 to 0.382 levels could act as initial resistance if the price moves upwards, pointing to potential selling opportunities for traders.
Conclusion
The Trade Desk, Inc. has been in a strong downtrend as reflected by its significant price drop from $89.58 in August 2025 to a low of $17.33 by June 2026. This analysis suggests the stock still has room to move down unless it breaches the 0.236 Fibonacci level, which might open room for a reversal. For potential investors, this stock's current undervalued position might present an opportunity, albeit with inherent risks. Analysts should focus on any upcoming financial results and macro factors that could influence price movements further, keeping an eye on critical support at the 0.236 level.
Smart Data Insight
Master the Perfect Entry & Exit for this Stock
Don't leave your profits to chance. Historically, this stock follows specific seasonal patterns that institutional traders use to maximize returns.
- ✅ Identify the "Golden Buying Window"
- ✅ Avoid high-risk correction cycles
- ✅ Backtested data from the last 20+ years