April 09, 2026 a 01:15 pm
TSN: Trend and Support & Resistance Analysis - Tyson Foods, Inc.
Tyson Foods' stock has shown a recent recovery after a prolonged downtrend, reflecting positive market sentiment. The current analysis identifies a potential uptrend shaping up, signaling opportunities for investors. Careful attention should be given to key support and resistance zones as they might dictate future price action. With the fluctuating food and meat industry, Tyson seems to be stabilizing, offering mixed prospects for investors.
Trend Analysis
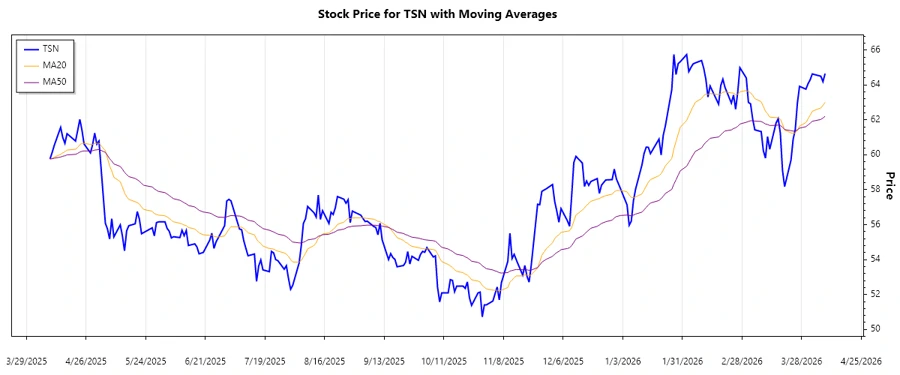
The analysis of Tyson Foods' recent stock data shows that the market has experienced fluctuating trends in the last months. Calculating the Exponential Moving Averages (EMAs), we found:
| Date | Close Price | Trend |
|---|---|---|
| 2026-04-08 | 64.65 | ▲ Uptrend |
| 2026-04-07 | 64.19 | ▲ Uptrend |
| 2026-04-06 | 64.5 | ▲ Uptrend |
| 2026-04-02 | 64.63 | ▲ Uptrend |
| 2026-04-01 | 64.3 | ⚖️ Sideways |
| 2026-03-31 | 64.07 | ⚖️ Sideways |
| 2026-03-30 | 63.76 | ⚖️ Sideways |
From this data, the trend aligns with a building uptrend. The alignment of the EMA20 consistently above the EMA50 supports a favorable outlook for buyers. This suggests possible gains if market conditions continue to hold.
Support and Resistance
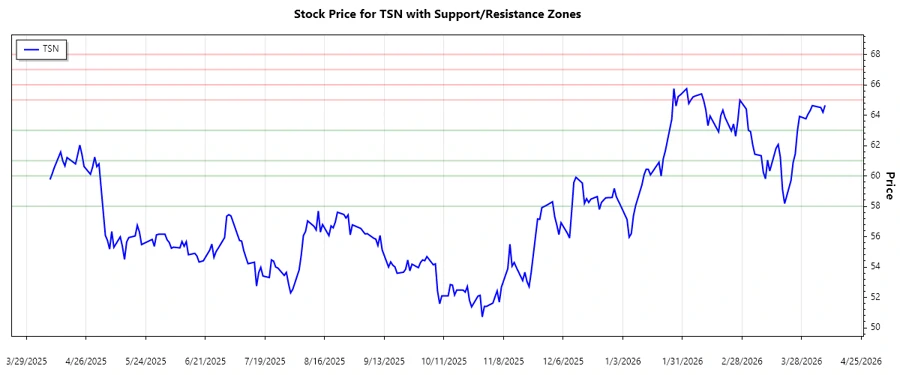
The price dataset allows us to evaluate potential support and resistance levels.
| Zone Type | From | To |
|---|---|---|
| Support | 61.00 | 63.00 |
| Support | 58.00 | 60.00 |
| Resistance | 65.00 | 66.00 |
| Resistance | 67.00 | 68.00 |
The current price of $64.65 stands within proximity of the resistance zone. As the stock approaches resistance levels, monitoring how prices react at these points will reveal market sentiment.
Conclusion
Overall, Tyson Foods, Inc. appears to be in a transitional phase where opportunities lie in capturing the emerging trend reversal. While the technical analysis shows promise with building upward momentum, significant resistance remains which could test investor sentiment. With the volatility inherent in the food industry, strategic positions should be weighed against such external factors. Both risks and rewards are present, necessitating due diligence.