March 17, 2026 a 03:15 am
TSN: Trend and Support & Resistance Analysis - Tyson Foods, Inc.
Tyson Foods, Inc. has demonstrated resilience in its stock performance, although recent trends suggest caution. Technical indicators point toward a declining pattern, emphasizing the importance of support levels. Investors should pay attention to the company's market position amidst shifting consumer preferences and economic changes. Consideration of both technical and fundamental factors will be crucial in the near future.
Trend Analysis
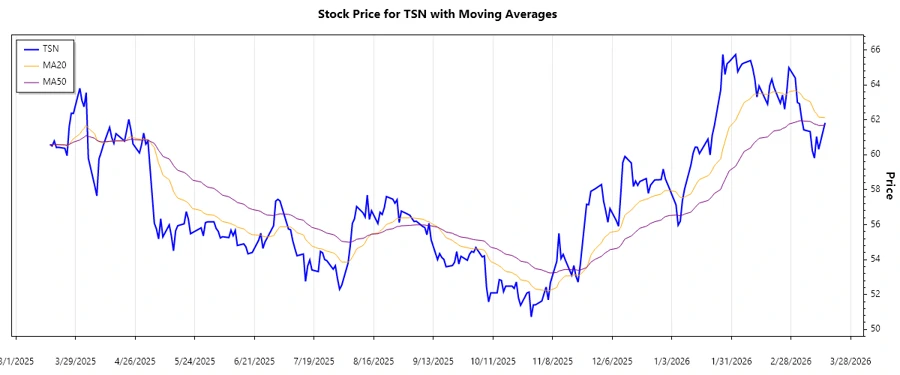
The trend analysis of Tyson Foods, Inc. reveals the following observations based on the EMA20 and EMA50 evaluations:
| Date | Close Price | Trend |
|---|---|---|
| March 16, 2026 | 61.83 | ▼ |
| March 13, 2026 | 60.32 | ▼ |
| March 12, 2026 | 61.04 | ▼ |
| March 11, 2026 | 59.81 | ▼ |
| March 10, 2026 | 60.24 | ▼ |
| March 9, 2026 | 61.33 | ▼ |
| March 6, 2026 | 61.43 | ▼ |
The computed EMAs suggest a predominant downward trend over the analyzed period, with EMA20 consistently below EMA50. This pattern typically signals a bearish market sentiment.
Support and Resistance
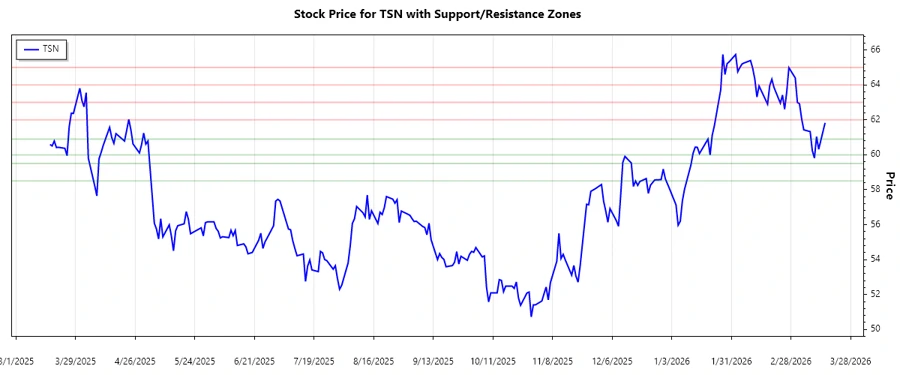
Analyzing recent price movements, the following support and resistance zones can be identified:
| Zone | Price Range | Status |
|---|---|---|
| Support 1 | 58.50 - 59.50 | ▲ |
| Support 2 | 60.00 - 60.90 | ▲ |
| Resistance 1 | 62.00 - 63.00 | ▼ |
| Resistance 2 | 64.00 - 65.00 | ▼ |
The current price is positioned near the upper support zone, indicating potential bounce-back opportunities if market conditions improve.
Conclusion
Tyson Foods’ stock presents a cautious yet opportunistic scenario for investors. The bearish trend demands vigilance while the defined support levels offer key observation points for potential price reversals. Market dynamics, along with the company's operational performance, will influence its trajectory. While not devoid of risks, strategic market entry at support zones or upon observing trend reversals could deliver favorable returns for informed investors.