November 19, 2025 a 07:47 am

TSN: Dividend Analysis - Tyson Foods, Inc.
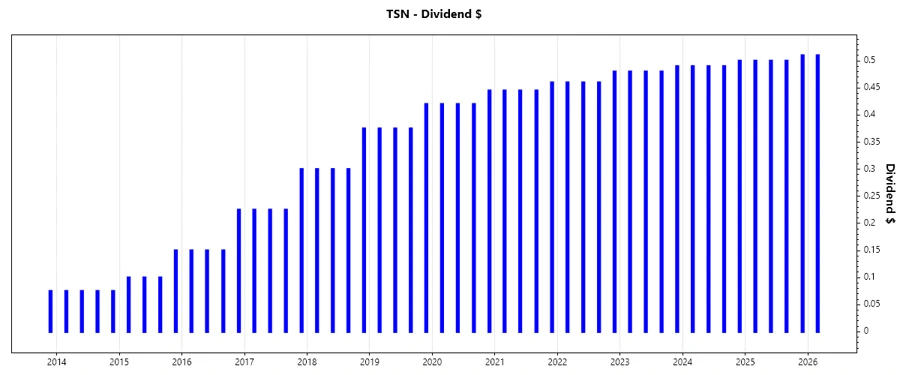
Tyson Foods, Inc. exhibits robust fundamentals with a stable market position in the Food Industry sector. The company sustains a healthy dividend yield amidst challenging market conditions, highlighting its commitment to shareholder returns. While the recent history shows a dividend cut scheduled for 2026, Tyson's longstanding dividend history, extending over 39 years, demonstrates an overarching dedication to maintaining shareholder value.
📊 Overview
Tyson Foods, Inc., operating in the Consumer Staples sector, shows a current dividend yield of 3.76%. With a current dividend per share of $2.00 and a resilient dividend history spanning 39 years, it offers attractive long-term investment potential. The last observed dividend cut or suspension is slated for 2026, posing a strategic consideration for prospective investors.
| Attribute | Value |
|---|---|
| Sector | Consumer Staples |
| Dividend yield | 3.76% |
| Current dividend per share | $2.00 USD |
| Dividend history | 39 years |
| Last cut or suspension | 2026 |
🗣️ Dividend History
The dividend history of Tyson Foods, Inc. underscores its strong shareholder commitment, with consistent dividend growth over the years. This historical performance is a crucial gauge of corporate health and investor confidence, making it fundamental in evaluating the company's financial sustainability.
| Year | Dividend per Share (USD) |
|---|---|
| 2026 | $0.51 |
| 2025 | $2.01 |
| 2024 | $1.97 |
| 2023 | $1.93 |
| 2022 | $1.86 |
📈 Dividend Growth
Examining the dividend growth rate provides insights into Tyson's strategic dividend policy. The figures for the last 3 and 5 years show slow yet positive growth, signaling careful fiscal management and commitment to delivering value to shareholders.
| Time | Growth |
|---|---|
| 3 years | 3.15% |
| 5 years | 4.98% |
The average dividend growth is 4.98% over 5 years. This shows moderate but steady dividend growth.
⚖️ Payout Ratio
Understanding the payout ratio is pivotal to assess how sustainable the dividends are alongside earnings. Tyson Foods has a 147% EPS-based payout ratio and a 61% FCF-based payout ratio. These figures suggest an aggressive dividend policy with high EPS payout, which may not be sustainable in the long term without sufficient earnings growth.
| Key figure | Ratio |
|---|---|
| EPS-based | 147% |
| Free cash flow-based | 61% |
The current high payout ratios could imply potential vulnerabilities in maintaining the dividend level if the income does not improve significantly.
💸 Cashflow & Capital Efficiency
Cash flow analysis and capital efficiency are critical to understanding the liquidity and operational effectiveness of Tyson Foods, Inc. These metrics provide insights into how efficiently the company can generate cash and cover its capital requirements.
| Year | 2025 | 2024 | 2023 |
|---|---|---|---|
| Free Cash Flow Yield | 6.24% | 6.92% | -1.05% |
| Earnings Yield | 2.51% | 3.79% | -3.63% |
| CAPEX to Operating Cash Flow | 45.38% | 43.71% | 110.67% |
| Stock-based Compensation to Revenue | 0.18% | 0.19% | 0.12% |
| Free Cash Flow / Operating Cash Flow Ratio | 54.62% | 56.29% | -10.67% |
A negative free cash flow yield in 2023 indicates cash flow pressures potentially affecting compensations and reinvestment abilities. However, historical data shows generally strong performance in capital efficiency.
🗂️ Balance Sheet & Leverage Analysis
The balance sheet and leverage ratios are essential indicators of Tyson's financial health and its ability to weather financial stresses. These metrics highlight the company's ability to meet its financial obligations and maintain a leverage structure that supports growth without excessive risk.
| Year | 2025 | 2024 | 2023 |
|---|---|---|---|
| Debt-to-Equity | 48.82% | 53.22% | 52.42% |
| Debt-to-Assets | 24.09% | 26.38% | 26.22% |
| Debt-to-Capital | 32.81% | 34.73% | 34.39% |
| Net Debt to EBITDA | 2.95x | 2.71x | 8.79x |
| Current Ratio | 1.55 | 2.04 | 1.34 |
| Quick Ratio | 0.66 | 0.95 | 0.52 |
| Financial Leverage | 2.03x | 2.02x | 2.00x |
While Tyson demonstrates relatively moderate levels of debt, a net debt to EBITDA ratio of above 8x in 2023 could pose heightened financial risk, necessitating strategic leverage management.
💪 Fundamental Strength & Profitability
Analyzing fundamental strength and profitability provides insights into a company's efficiency in utilizing assets and equity to generate profits. These metrics shed light on Tyson's operational success and strategic capacity to deliver long-term value.
| Year | 2025 | 2024 | 2023 |
|---|---|---|---|
| Return on Equity | 2.62% | 4.35% | -3.57% |
| Return on Assets | 1.29% | 2.15% | -1.79% |
| Margins: Net | 0.87% | 1.50% | -1.23% |
| Margins: EBIT | 2.24% | 2.95% | -0.61% |
| Margins: EBITDA | 4.74% | 5.58% | 1.92% |
| Margins: Gross | 6.54% | 6.80% | 4.98% |
| Research & Development to Revenue | 0% | 0% | 0% |
Tyson's return metrics reflect a need for enhanced efficiency, given the decline in 2023, suggesting potential operational challenges and adverse market conditions impacting profitability.
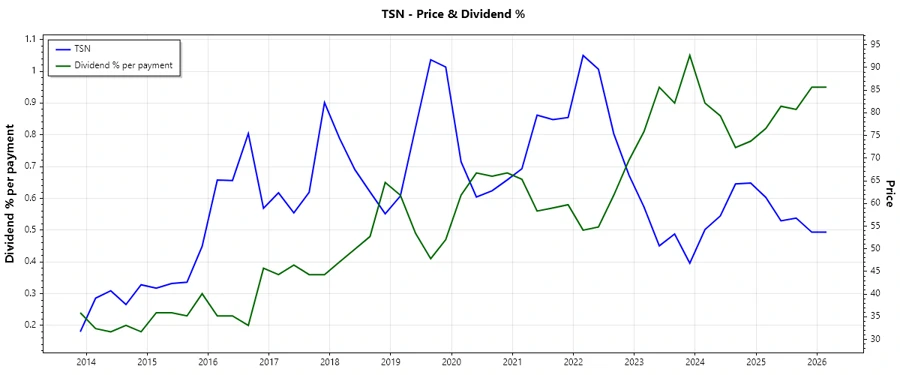
📉 Price Development
🔍 Dividend Scoring System
| Criteria | Score | Score Bar |
|---|---|---|
| Dividend yield | 3 | |
| Dividend Stability | 4 | |
| Dividend growth | 3 | |
| Payout ratio | 2 | |
| Financial stability | 3 | |
| Dividend continuity | 5 | |
| Cashflow Coverage | 2 | |
| Balance Sheet Quality | 3 |
Total Score: 25/40
✅ Rating
Tyson Foods, Inc. demonstrates a resilient dividend-paying structure underscored by a longstanding history, yet with room for improvement in fundamental and leverage metrics. The current strategies indicate cautious optimism, contingent on improved profit conversion to uphold its market position and dividend commitments. The stock could suit investors seeking stable income, though mindful of certain growth and fiscal efficiency constraints.
Smart Data Insight
Master the Perfect Entry & Exit for this Stock
Don't leave your profits to chance. Historically, this stock follows specific seasonal patterns that institutional traders use to maximize returns.
- ✅ Identify the "Golden Buying Window"
- ✅ Avoid high-risk correction cycles
- ✅ Backtested data from the last 20+ years