October 25, 2025 a 04:03 am
TSLA: Trend and Support & Resistance Analysis - Tesla, Inc.
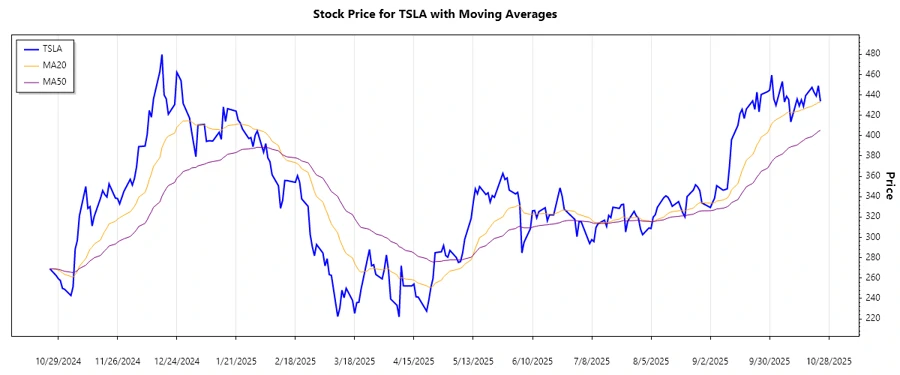
Tesla's stock has experienced noteworthy movements over the past months, characterized by periods of significant growth followed by corrective patterns. The recent trend suggests a potential for upward momentum, although market volatility and external factors like regulatory changes could impact stock performance. The technical indicators hint at both possibilities of growth and potential consolidations in the near term.
Trend Analysis
| Date | Close Price | Trend |
|---|---|---|
| 2025-10-24 | 433.72 | ▼ |
| 2025-10-23 | 448.98 | ▲ |
| 2025-10-22 | 438.97 | ▼ |
| 2025-10-21 | 442.60 | ▲ |
| 2025-10-20 | 447.43 | ▲ |
| 2025-10-17 | 439.31 | ▼ |
| 2025-10-16 | 428.75 | ▼ |
The short-term EMAs indicate that the EMA20 is greater than the EMA50, suggesting a possible uptrend. A closer look at recent movements reveals volatility but a general upward bias influenced by the broader market conditions.
Support and Resistance
| Zone | From | To |
|---|---|---|
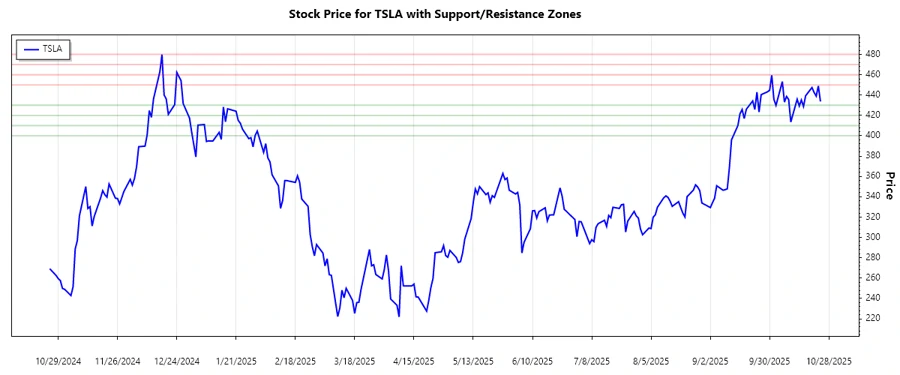
| Resistance 1 | 450.00 | 460.00 |
| Resistance 2 | 470.00 | 480.00 |
| Support 1 | 420.00 | 430.00 |
| Support 2 | 400.00 | 410.00 |
Currently, the stock price is hovering near the identified resistance zone, suggesting potential upward momentum could face some challenges ahead. Testing these levels could determine the next major move for Tesla’s stock.
Conclusion
In summary, Tesla, Inc. displays a promising trajectory with periods of volatility. While the technical indicators suggest an upward trend, potential resistance zones may temper rapid gains. Long-term prospects remain favorable given Tesla’s innovation-driven approach, but caution is warranted due to external market pressures. Investors should watch for breakouts or breakdowns at key levels to inform trading strategies.
Smart Data Insight
Master the Perfect Entry & Exit for this Stock
Don't leave your profits to chance. Historically, this stock follows specific seasonal patterns that institutional traders use to maximize returns.
- ✅ Identify the "Golden Buying Window"
- ✅ Avoid high-risk correction cycles
- ✅ Backtested data from the last 20+ years