
June 24, 2026 a 03:15 pm
TSLA: Fibunacci Analysis - Tesla, Inc.
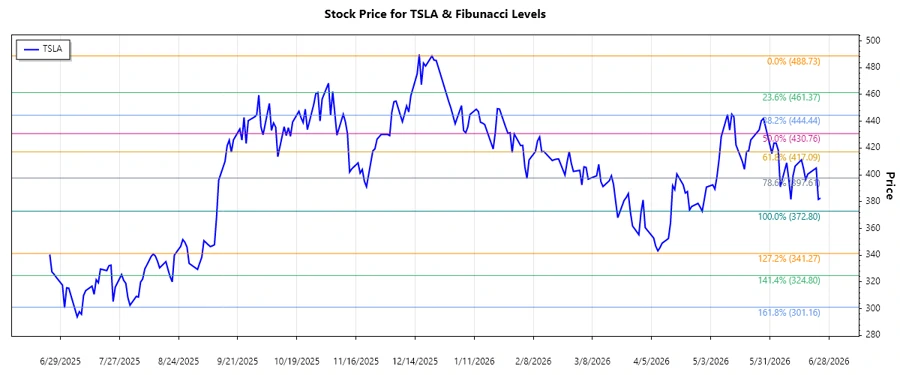
Tesla, Inc. (TSLA) continues to be at the forefront of the automotive and energy industry with its innovative electric vehicles and energy solutions. The stock has experienced significant fluctuations over the past months, highlighting investor sentiment and market volatility. As we look at the recent trend patterns, it becomes crucial to analyze these through technical indicators like Fibonacci retracement to gauge potential support and resistance levels.
Fibonacci Analysis
| Details | Information |
|---|---|
| Trend Start Date | 2025-12-23 |
| Trend End Date | 2026-06-24 |
| High Price (Date) | 488.73 (2025-12-22) |
| Low Price (Date) | 372.8 (2026-04-29) |
| Fibonacci Level 0.236 | 400.99 |
| Fibonacci Level 0.382 | 419.13 |
| Fibonacci Level 0.5 | 430.77 |
| Fibonacci Level 0.618 | 442.41 |
| Fibonacci Level 0.786 | 459.55 |
| Current Price | 382.59 |
| Retracement Zone | None |
| Technical Interpretation | The stock is currently below the lowest Fibonacci level suggesting potential for further decline or a strong support formation. |
Conclusion
The current analysis of Tesla, Inc. stock indicates a potential for recovery, but its position below the Fibonacci retracement levels suggests that caution is advised. The market trend indicates some resistance at higher price levels, specifically between the 0.382 and 0.5 Fibonacci levels. For investors, this means carefully monitoring market conditions and overall sentiment towards Tesla's innovations and achievements in the industry. Technically, breaking past the 0.236 Fibonacci level creates an opportunity for upward movement back towards significant resistance levels.
Smart Data Insight
Master the Perfect Entry & Exit for this Stock
Don't leave your profits to chance. Historically, this stock follows specific seasonal patterns that institutional traders use to maximize returns.
- ✅ Identify the "Golden Buying Window"
- ✅ Avoid high-risk correction cycles
- ✅ Backtested data from the last 20+ years