May 10, 2026 a 04:44 pm
TSLA: Fibonacci Analysis - Tesla, Inc.
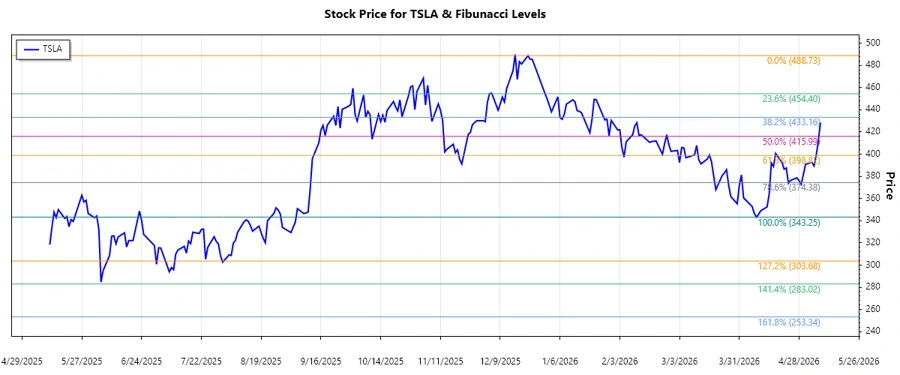
Tesla, Inc. (TSLA) has shown significant volatility over the recent months, with a notable downward trend in its stock prices. Key factors affecting its performance include competitive pressures in the EV market and macroeconomic conditions. Analysts are closely watching as the stock's technical levels present potential entry points for investors.
Fibonacci Analysis
| Detail | Information |
|---|---|
| Trend Start Date | 2025-12-22 |
| Trend End Date | 2026-05-08 |
| High Price | $488.73 on 2025-12-22 |
| Low Price | $343.25 on 2026-04-08 |
| Fibonacci Levels |
|
| Current Price | $428.35 as of 2026-05-08 |
| Retracement Zone | 0.618 |
| Interpretation | The current price indicates a retracement into the 0.618 level, suggesting a possible resistance zone. |
Conclusion
Tesla's stock, following a decline from its highs, has begun to exhibit signs of stabilization. The current position in the 0.618 Fibonacci retracement level may suggest potential resistance, which could prompt cautious trading strategies. While long-term growth prospects in the EV sector remain robust, competition and economic variables pose risks. Analysts should consider these Fibonacci levels when making investment decisions, as they provide crucial insight into market psychology and potential price reversals.
Smart Data Insight
Master the Perfect Entry & Exit for this Stock
Don't leave your profits to chance. Historically, this stock follows specific seasonal patterns that institutional traders use to maximize returns.
- ✅ Identify the "Golden Buying Window"
- ✅ Avoid high-risk correction cycles
- ✅ Backtested data from the last 20+ years