February 22, 2026 a 11:44 am

TSLA: Fibonacci Analysis - Tesla, Inc.
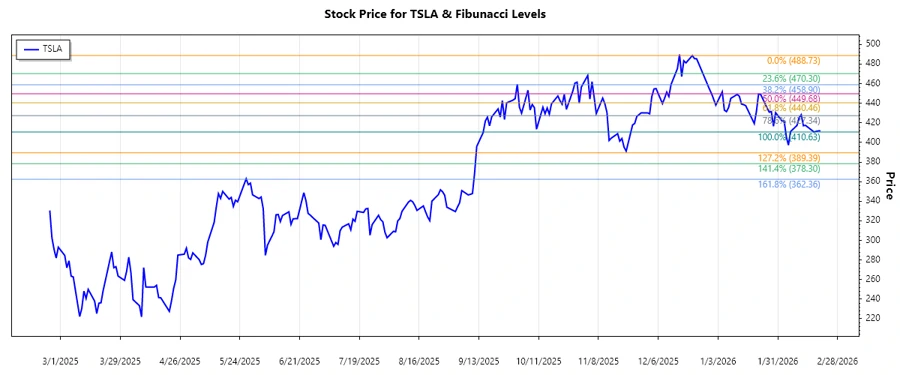
Tesla, Inc. has been a leading innovator in the electric vehicle and energy sectors, experiencing significant growth over the years. Recent price movements indicate a strong downward trend, presenting technical insights for potential investors. Analyzing these trends with Fibonacci retracement levels can provide clearer insights into potential support and resistance areas for TSLA.
Fibonacci Analysis
Our analysis detects a dominance in the downward trend between December 2025 and February 2026. Utilizing the Fibonacci retracement tool, we calculate the potential levels that could act as support.
| Analysis Information | Data |
|---|---|
| Trend Start Date | 2025-12-22 |
| Trend End Date | 2026-02-20 |
| High Price | $488.73 (2025-12-22) |
| Low Price | $410.63 (2026-02-17) |
| Fibonacci Level | Price Level |
|---|---|
| 0.236 | $469.53 |
| 0.382 | $450.58 |
| 0.5 | $449.68 |
| 0.618 | $447.77 |
| 0.786 | $435.76 |
Currently, the TSLA stock price is at $411.82, which does not fall within the identified Fibonacci retracement zones. However, these levels can act as potential resistance zones in the future.
In conclusion, the current trend suggests that if Tesla's stock price approaches these Fibonacci levels, they could potentially act as significant resistance. Investors should monitor these levels for signs of reversal or continuation.
Conclusion
Tesla, Inc.'s stock has been under a corrective phase from its recent highs. The Fibonacci retracement levels provide a technical framework to assess potential areas where the stock might face resistance or find support. The ongoing downward trend poses risks; however, an opportunity for reversal exists if key resistance levels are surpassed. For analysts and investors, monitoring these levels is crucial, as it offers insights into significant price action that may influence future market behavior. Given the current market conditions, strategic patience is advisable, capitalizing on potential upsides when trend reversals are confirmed.