June 19, 2025 a 10:15 am

TSLA: Fibonacci Analysis - Tesla, Inc.
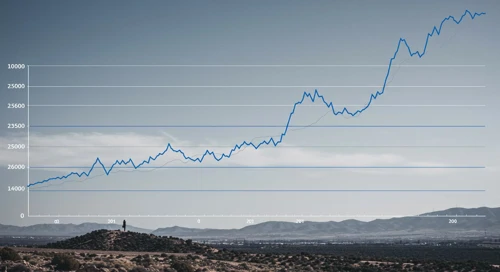
Tesla, Inc. is a leader in electric vehicles and energy solutions. Despite recent market volatility, its innovation and strong brand presence maintain investor interest. As the EV market continues to grow, Tesla’s strategic moves in energy storage could further enhance its market position.
Fibonacci Analysis
| Parameter | Details |
|---|---|
| Trend Type | Downtrend |
| Start Date | 2024-12-26 |
| End Date | 2025-04-21 |
| High Point (Price & Date) | 462.28 on 2024-12-24 |
| Low Point (Price & Date) | 227.5 on 2025-04-21 |
| Fibonacci Level | Price Level |
|---|---|
| 0.236 | 317.15 |
| 0.382 | 355.70 |
| 0.5 | 379.89 |
| 0.618 | 404.08 |
| 0.786 | 435.01 |
Currently, the price hovers around the 0.382 retracement level, suggesting potential resistance at this point.
The presence of the stock at the 0.382 level indicates a possible resistance, which could either signal a halt in the current price recovery or a continuation upwards if broken.
Conclusion
Tesla's stock has recently undergone a downward trend but shows signs of stabilization. While the technical analysis indicates potential resistance at the 0.382 Fibonacci level, a break above could signify further recovery. In the longer term, Tesla's investments in technology and infrastructure could bolster growth. However, market volatility and competitive pressures remain key risks. Analysts may see opportunities for rebound if bullish momentum resumes.
Smart Data Insight
Master the Perfect Entry & Exit for this Stock
Don't leave your profits to chance. Historically, this stock follows specific seasonal patterns that institutional traders use to maximize returns.
- ✅ Identify the "Golden Buying Window"
- ✅ Avoid high-risk correction cycles
- ✅ Backtested data from the last 20+ years