May 01, 2026 a 02:03 pm
TSCO: Trend and Support & Resistance Analysis - Tractor Supply Company
Tractor Supply Company (TSCO) has been experiencing fluctuations in its stock price over the past few months, with notable volatility. While the stock has witnessed prominent highs and lows, the overall trend needs careful assessment to determine future price movements. Investors should closely monitor the identified support and resistance zones to make informed decisions.
Trend Analysis
| Date | Close Price | Trend |
|---|---|---|
| 2026-05-01 | 34.77 | ▼ |
| 2026-04-30 | 35.10 | ▼ |
| 2026-04-29 | 34.77 | ▼ |
| 2026-04-28 | 35.59 | ▼ |
| 2026-04-27 | 35.67 | ▼ |
| 2026-04-24 | 36.74 | ▼ |
| 2026-04-23 | 38.17 | ▼ |
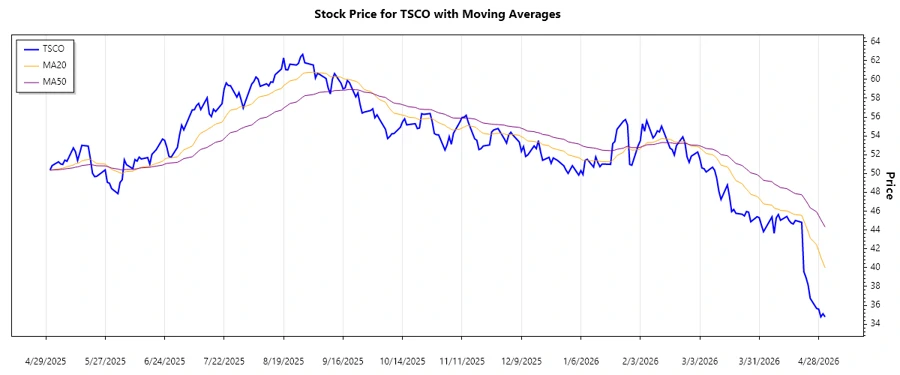
Currently, the stock is showing a persistent downtrend as the EMA20 has crossed below the EMA50. This indicates bearish sentiment across the short and medium term, urging caution for potential buyers.
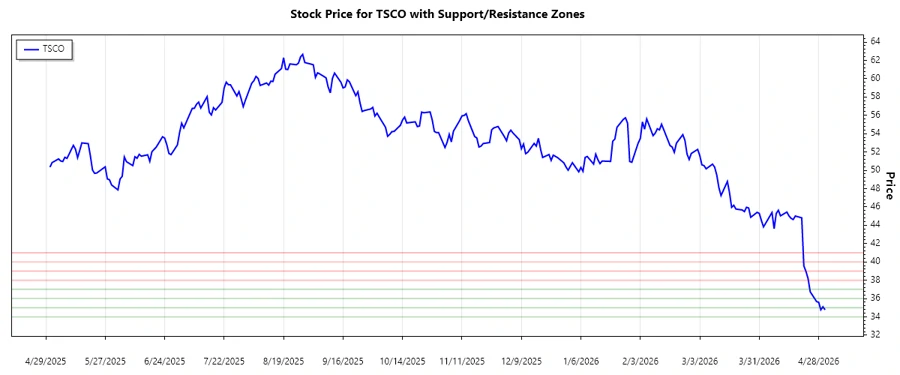
Support and Resistance Levels
| Zone Type | From | To |
|---|---|---|
| Support 1 | $34.00 | $35.00 |
| Support 2 | $36.00 | $37.00 |
| Resistance 1 | $38.00 | $39.00 |
| Resistance 2 | $40.00 | $41.00 |
The current price is approaching the first support zone, which could offer temporary reprieve and potentially bounce if there is sufficient buyer interest.
Conclusion
Tractor Supply Company's stock is facing downward pressure with notable resistance levels above, suggesting a challenging environment for long positions. However, the identified support zones might provide some buffer against further declines. Investors should remain vigilant and consider market conditions before committing to new positions. Historical volatility implies that traders should prepare for possible abrupt shifts in stock direction.