June 07, 2025 a 03:15 am


TSCO: Trend and Support & Resistance Analysis - Tractor Supply Company
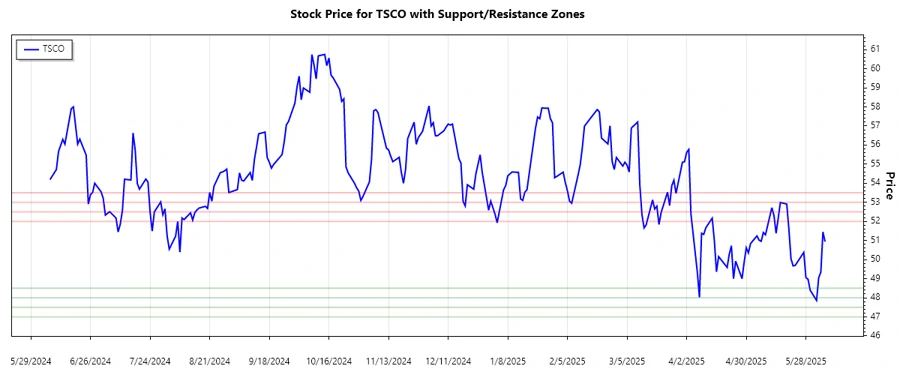
Tractor Supply Company (TSCO) has exhibited fluctuations over the recent months with a noticeable change in trend direction. By analyzing the recent price movements and key indicators like EMA20 and EMA50, we get insights into its current technical stance. This analysis will delve into the stock's existing trend and identify critical support and resistance levels to understand its potential market trajectory.
Trend Analysis
| Date | Close Price | Trend |
|---|---|---|
| 2025-06-06 | $50.94 | ▼ |
| 2025-06-05 | $51.45 | ▼ |
| 2025-06-04 | $49.34 | ▼ |
| 2025-06-03 | $49.05 | ▼ |
| 2025-06-02 | $47.86 | ▼ |
| 2025-05-30 | $48.4 | ▼ |
| 2025-05-29 | $48.97 | ▼ |
The trend over the last week indicates a downward direction as the EMA20 is below the EMA50, suggesting a bear market sentiment.
Support and Resistance
| Zone Type | From | To |
|---|---|---|
| Support 1 | $48.00 | $48.50 |
| Support 2 | $47.00 | $47.50 |
| Resistance 1 | $52.00 | $52.50 |
| Resistance 2 | $53.00 | $53.50 |
The stock is currently within the first support zone. Breaching this level might lead to further declines, while a bounce could indicate recovery potential.
In conclusion, Tractor Supply Company's stock shows a downtrend with potential risks if support levels are broken. Investors should monitor these critical zones closely for any reversal signs. Strategically, understanding these support and resistance levels helps make informed decisions on potential entry or exit points. Utilizing technical indicators like EMA20 and EMA50 can further augment predictions about trends, supporting timely investment strategies.
Smart Data Insight
Master the Perfect Entry & Exit for this Stock
Don't leave your profits to chance. Historically, this stock follows specific seasonal patterns that institutional traders use to maximize returns.
- ✅ Identify the "Golden Buying Window"
- ✅ Avoid high-risk correction cycles
- ✅ Backtested data from the last 20+ years