February 18, 2026 a 11:44 am
TSCO: Fibonacci Analysis - Tractor Supply Company
Tractor Supply Company (TSCO) has demonstrated a notable trend in its stock price over the past few months. Its diverse range of merchandise and strong presence in the rural lifestyle retail market suggest steadiness. However, recent fluctuations in stock prices may reflect macroeconomic challenges. Investors should closely analyze the potential support and resistance levels indicated by technical indicators.
Fibonacci Analysis
| Trend Analysis | Details |
|---|---|
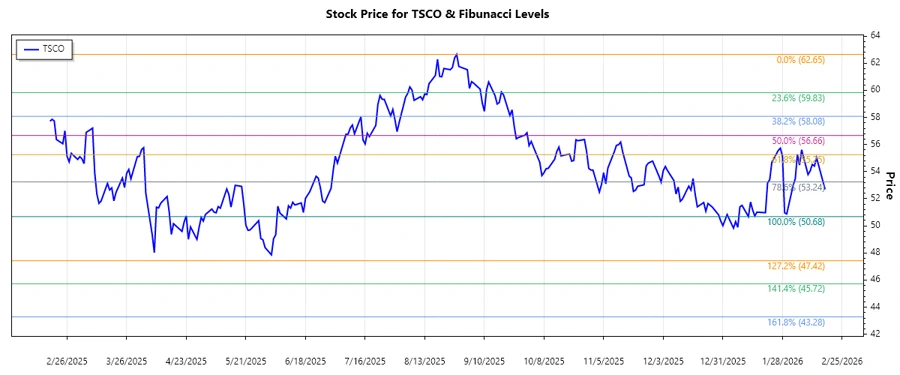
| Start Date | 2025-08-04 |
| End Date | 2026-01-27 |
| High Point | $62.65 (2025-08-28) |
| Low Point | $50.68 (2026-01-12) |
| Fibonacci Level | Price |
|---|---|
| 0.236 | $53.65 |
| 0.382 | $55.22 |
| 0.5 | $56.67 |
| 0.618 | $58.12 |
| 0.786 | $60.16 |
Current price suggests it is nearing the 0.236 retracement level, indicating potential support. Technical interpretation suggests caution as this level may act as a support zone. Breaking below could signal further downside.
Conclusion
Tractor Supply Company's stock demonstrates variability indicative of the broader market trends. The company's diverse product portfolio offers resilience against market fluctuations. However, breaking major support levels could pose a risk of further decline. Investors are advised to consider technical indicators alongside fundamental analysis to assess potential buying or selling opportunities. Monitoring macroeconomic conditions and consumer spending trends remains essential for future forecasts.