August 11, 2025 a 03:31 am

TSCO: Dividend Analysis - Tractor Supply Company
Tractor Supply Company shows a commendable dividend profile with consistent growth and stability over the years. As a stakeholder, you can appreciate the company’s dedication to increasing shareholder value through regular dividend payments. Despite market fluctuations, TSCO has managed to maintain a solid dividend history without any recent cuts or suspensions, indicating strong financial health aligned with its strategic objectives.
📊 Overview
The following table outlines key dividend metrics for Tractor Supply Company, offering insights into sector alignment and profitability:
| Metric | Value |
|---|---|
| Sector | Retail |
| Dividend Yield | 1.54% |
| Current Dividend per Share | 0.88 USD |
| Dividend History | 16 years |
| Last Cut or Suspension | None |
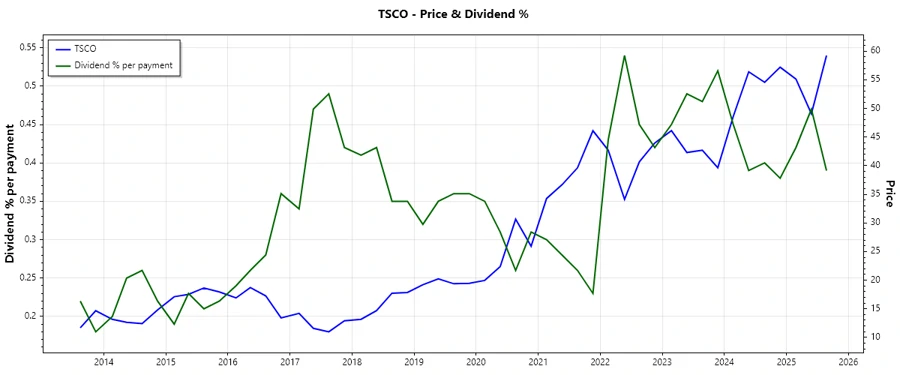
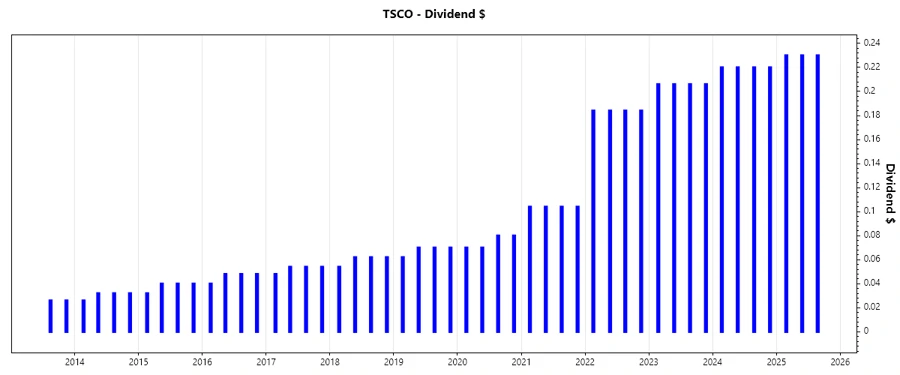
📈 Dividend History
The consistency in dividend payments over the past years exemplifies Tractor Supply Company's commitment to its shareholders. This is crucial for long-term investors looking for reliable income streams.
| Year | Dividend per Share (USD) |
|---|---|
| 2025 | 0.69 |
| 2024 | 0.88 |
| 2023 | 0.824 |
| 2022 | 0.736 |
| 2021 | 0.416 |
📉 Dividend Growth
Continuous growth in dividends over the years reflects the robust financial management and growth strategy of TSCO.
| Time | Growth |
|---|---|
| 3 years | 28.37% |
| 5 years | 26.47% |
The average dividend growth is 26.47% over 5 years. This shows moderate but steady dividend growth.
✅ Payout Ratio
Understanding payout ratios is key to assessing a company's ability to maintain and grow its dividend payments.
| Key Figure | Ratio |
|---|---|
| EPS-based | 42.92% |
| Free Cash Flow-based | 56.86% |
The EPS-based payout ratio of 42.92% and the FCF-based ratio of 56.86% indicate a balanced approach to dividend payouts, preserving sufficient earnings for growth investments.
📊 Cashflow & Capital Efficiency
Cash flow yields and capital efficiency metrics provide insights into TSCO's operational and financial performance sustainability.
| Year | 2024 | 2023 | 2022 |
|---|---|---|---|
| Free Cash Flow Yield | 2.17% | 2.47% | 2.33% |
| Earnings Yield | 3.76% | 4.72% | 4.35% |
| CAPEX to Operating Cash Flow | 55.18% | 56.51% | 56.99% |
| Stock-based Compensation to Revenue | 0.32% | 0.39% | 0.38% |
| Free Cash Flow / Operating Cash Flow Ratio | 44.82% | 43.49% | 43.01% |
The stability in cash flows and capital efficiency demonstrates TSCO’s ability to generate rewarding returns on invested capital consistently.
🛡️ Balance Sheet & Leverage Analysis
The balance sheet ratios are indicative of TSCO's financial leverage and risk profile, critical for understanding long-term sustainability.
| Year | 2024 | 2023 | 2022 |
|---|---|---|---|
| Debt-to-Equity | 238.93% | 234.26% | 209.07% |
| Debt-to-Assets | 55.32% | 54.81% | 50.30% |
| Debt-to-Capital | 70.50% | 70.08% | 67.65% |
| Net Debt to EBITDA | 2.70x | 2.48x | 2.29x |
| Current Ratio | 1.28 | 1.50 | 1.33 |
| Quick Ratio | 0.20 | 0.28 | 0.19 |
| Financial Leverage | 431.90% | 427.40% | 415.68% |
High leverage ratios suggest potential financial risk, but current and quick ratios above 1 indicate TSCO’s ability to meet short-term obligations satisfactorily.
🗣️ Fundamental Strength & Profitability
Key profitability ratios demonstrate the efficiency of TSCO in generating profits from its equity and assets.
| Year | 2024 | 2023 | 2022 |
|---|---|---|---|
| Return on Equity | 48.51% | 51.50% | 53.31% |
| Return on Assets | 11.23% | 12.05% | 12.82% |
| Net Margin | 7.40% | 7.61% | 7.66% |
| EBIT Margin | 9.86% | 10.16% | 10.10% |
| EBITDA Margin | 12.86% | 12.86% | 12.52% |
| Gross Margin | 36.26% | 35.92% | 35.00% |
| R&D to Revenue | 0% | 0% | 0% |
Consistent profitability underscores TSCO’s strategic execution, ensuring growth and sustainability in its operations.
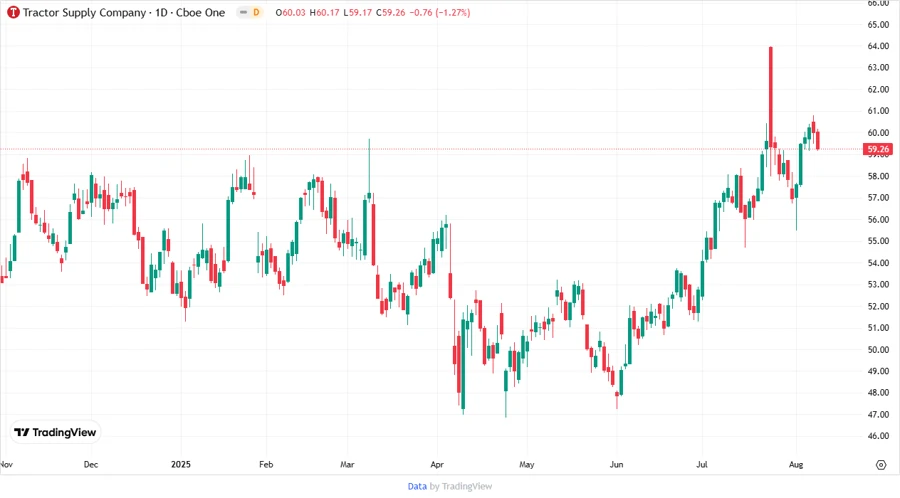
📈 Price Development
✅ Dividend Scoring System
| Category | Score | Bar |
|---|---|---|
| Dividend Yield | 3 | |
| Dividend Stability | 5 | |
| Dividend Growth | 4 | |
| Payout Ratio | 4 | |
| Financial Stability | 4 | |
| Dividend Continuity | 5 | |
| Cashflow Coverage | 3 | |
| Balance Sheet Quality | 3 |
Overall Score: 31/40
⚠️ Rating
Tractor Supply Company demonstrates robust dividend policies with healthy growth and consistent payments, suitable for income-focused investors. Strong financials and stable profitability support continuation of the current dividend trajectory. However, potential market disruptions should be monitored. The stock fits well into a diversified income-oriented portfolio.